

Network Monitoring Overview
Starter
Professional
How It Works
Section titled “How It Works”Bleemeo monitors network devices using SNMP (Simple Network Management Protocol). A Glouton agent paired with a Prometheus SNMP exporter queries your devices and sends metrics to the Bleemeo Cloud Platform.
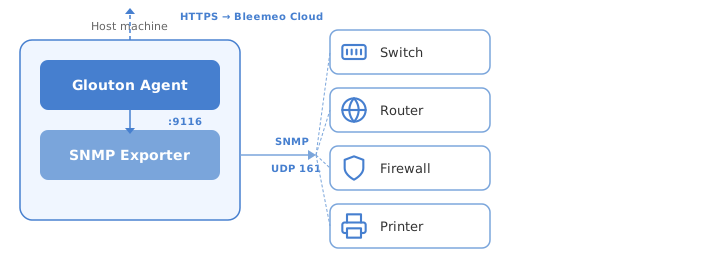
The setup requires:
- A Bleemeo Glouton agent running on a Linux or Windows machine
- A Prometheus SNMP exporter on the same machine, querying devices via SNMP (UDP port 161)
Supported Devices
Section titled “Supported Devices”Glouton automatically detects the device type and applies the appropriate SNMP module. Devices marked with Auto are automatically detected. Others require contacting support to enable the appropriate SNMP module.
| Brand | Model | Detection | Uptime | Interfaces | Traffic | Errors | CPU | Memory | Other |
|---|---|---|---|---|---|---|---|---|---|
| APC | UPS | Manual | ✓ | — | — | — | — | — | Battery, input/output power |
| Arista | Switches | Manual | ✓ | ✓ | ✓ | ✓ | ✓ | ✓ | |
| Cisco | ASA | Auto | ✓ | ✓ | ✓ | ✓ | ✓ | ✓ | |
| Catalyst | Auto | ✓ | ✓ | ✓ | ✓ | ✓ | ✓ | Temperature | |
| Nexus | Auto | ✓ | ✓ | ✓ | ✓ | ✓ | ✓ | ||
| WLC | Manual | ✓ | ✓ | ✓ | ✓ | ✓ | ✓ | ||
| Dell | PowerConnect | Auto | ✓ | ✓ | ✓ | ✓ | ✓ | — | |
| HP | LaserJet | Auto | ✓ | — | — | — | — | — | Supplies level |
| Kemp | LoadMaster | Manual | ✓ | ✓ | ✓ | ✓ | ✓ | — | |
| MikroTik | RouterOS | Manual | ✓ | ✓ | ✓ | ✓ | ✓ | ✓ | |
| NEC | IX | Manual | ✓ | ✓ | ✓ | ✓ | ✓ | ✓ | |
| Palo Alto | Firewalls | Manual | ✓ | ✓ | ✓ | ✓ | ✓ | ✓ | |
| Synology | NAS | Manual | ✓ | ✓ | ✓ | ✓ | ✓ | ✓ | Disk, temperature |
| Ubiquiti | UniFi APs (U6-Lite, etc.) | Auto | ✓ | ✓ | ✓ | ✓ | ✓ | — | |
| UniFi Switches (USW-*) | Auto | ✓ | ✓ | ✓ | ✓ | ✓ | — | ||
| AirFiber | Manual | ✓ | ✓ | ✓ | ✓ | ✓ | — | ||
| AirMax | Manual | ✓ | ✓ | ✓ | ✓ | ✓ | — | ||
| VMware | ESXi | Auto | ✓ | ✓ | ✓ | ✓ | ✓ | ✓ |
See the SNMP Metrics page for the full list of collected metrics.
Add New MIB
Section titled “Add New MIB”If your device is not listed or you need proprietary MIBs, contact us at [email protected] with a snmpwalk capture. Generate it with the following command:
snmpwalk -v2c -c public -ObentU DEVICE_IP 1.3.6 > ./public.snmpwalkNext Steps
Section titled “Next Steps”- Installation — step-by-step setup on Linux and Windows
- SNMP Metrics — full list of collected metrics