Custom Dashboards
Free
Starter
Professional
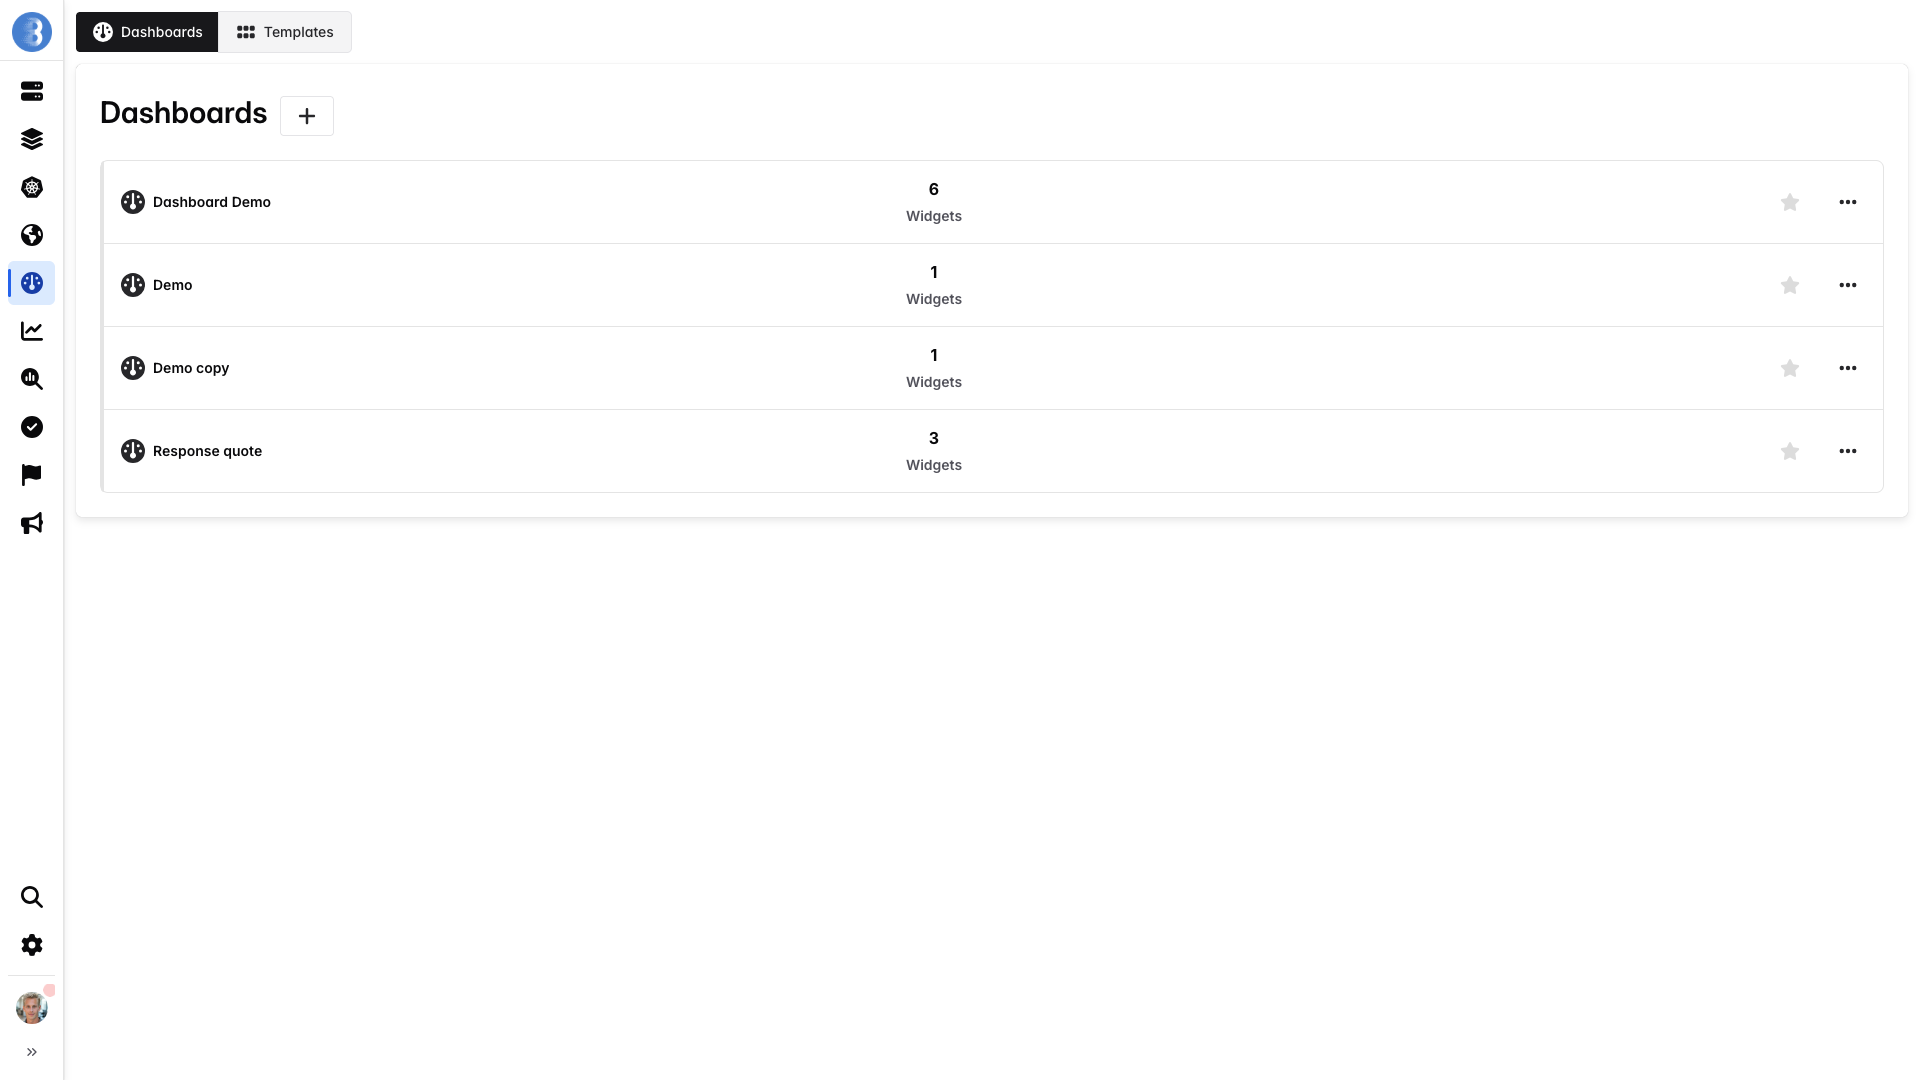
On this page you can see a list of your custom dashboards, create a new one, edit or delete the existing ones.
Compared to the dashboards you will find in the agent views, those custom dashboards are completely customizable: you can add metrics from different agents, from different sources.
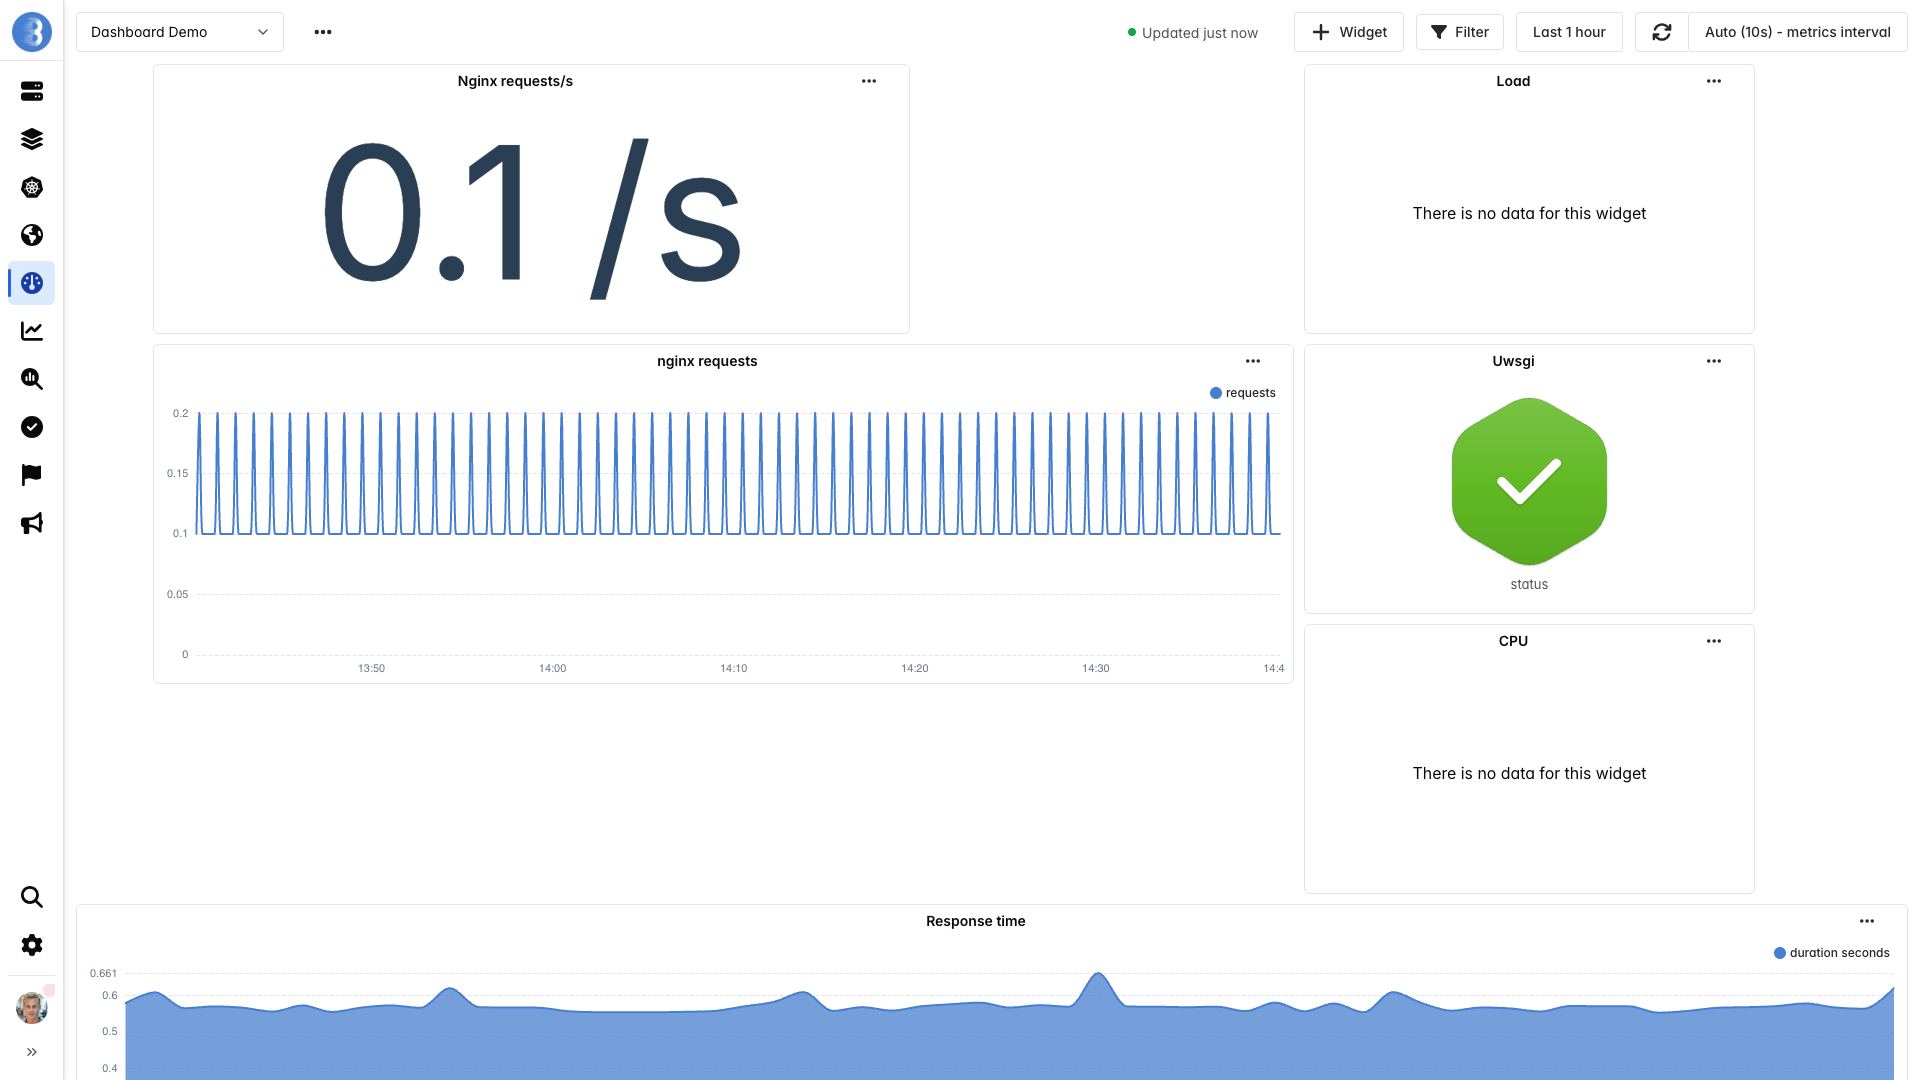
Here is an example of a custom dashboard.
You can click on a dashboard to display it as below.
Edit Dashboards
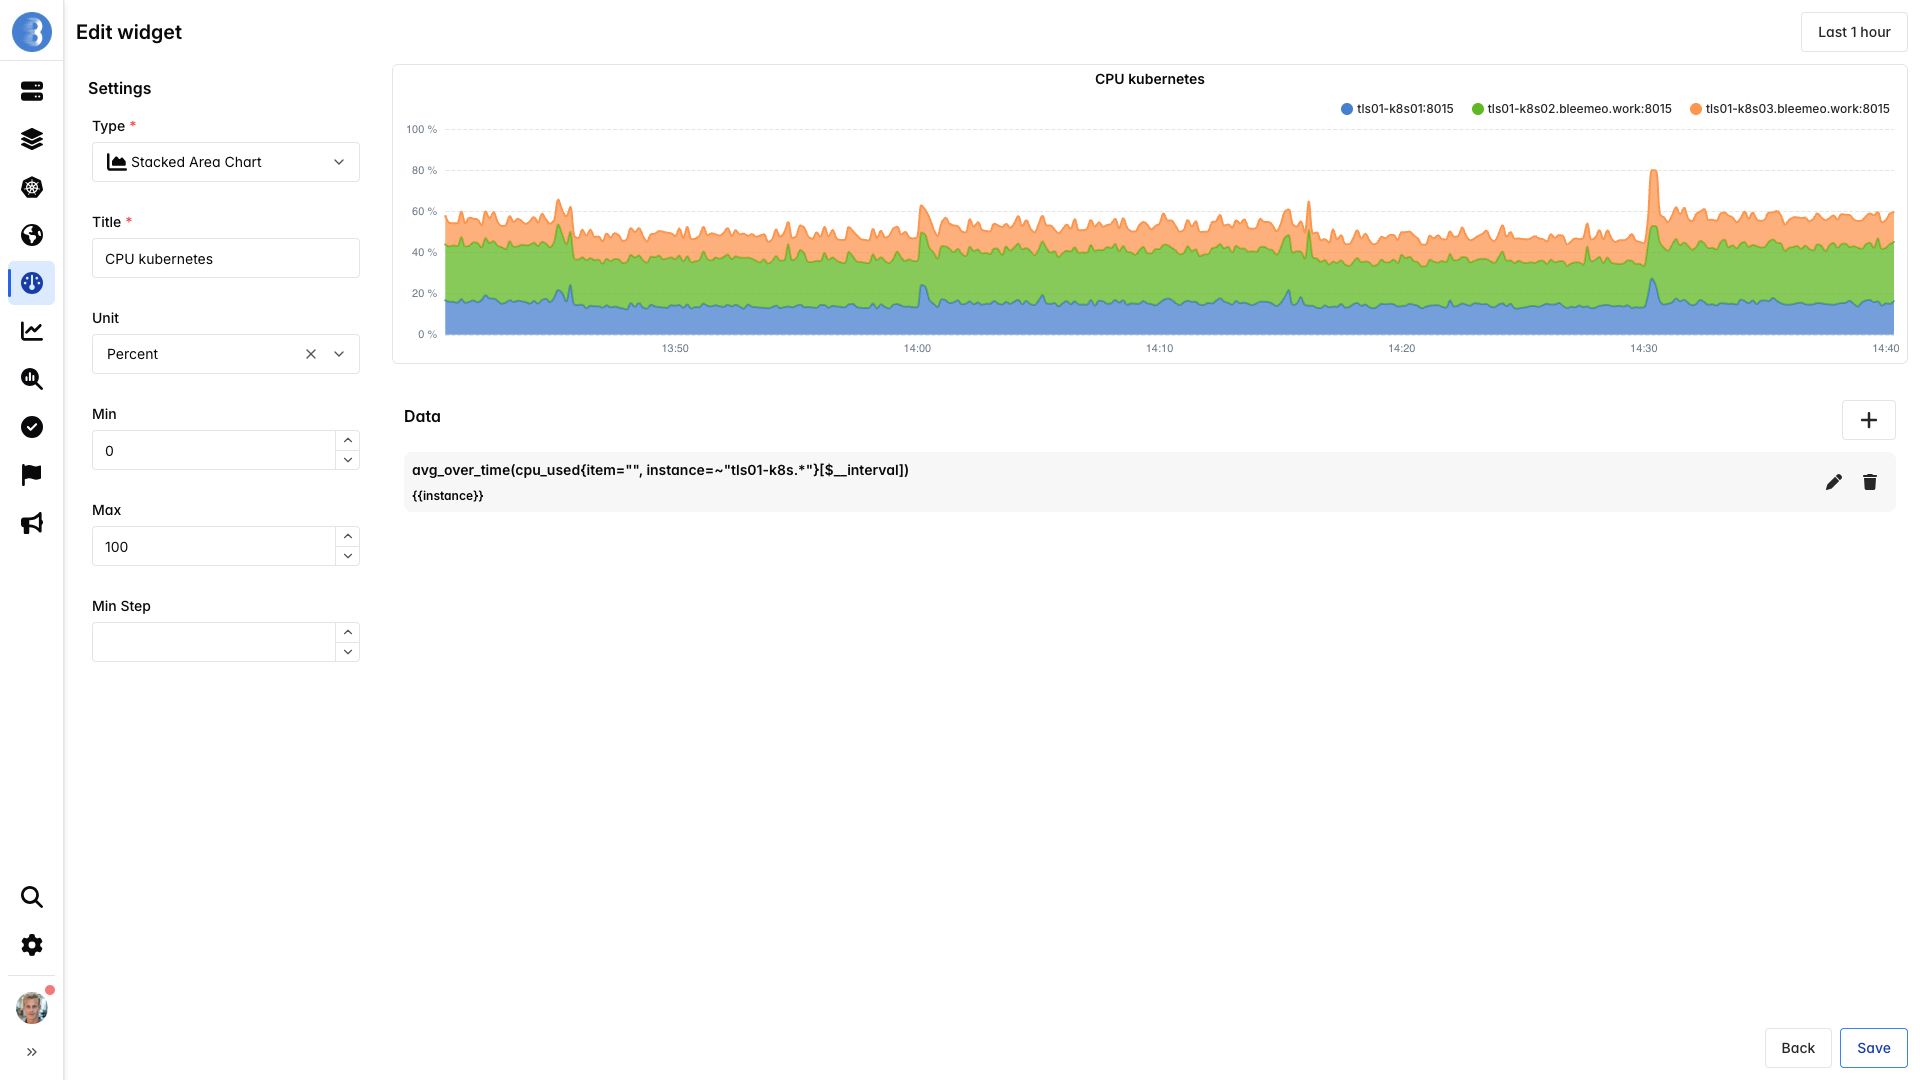
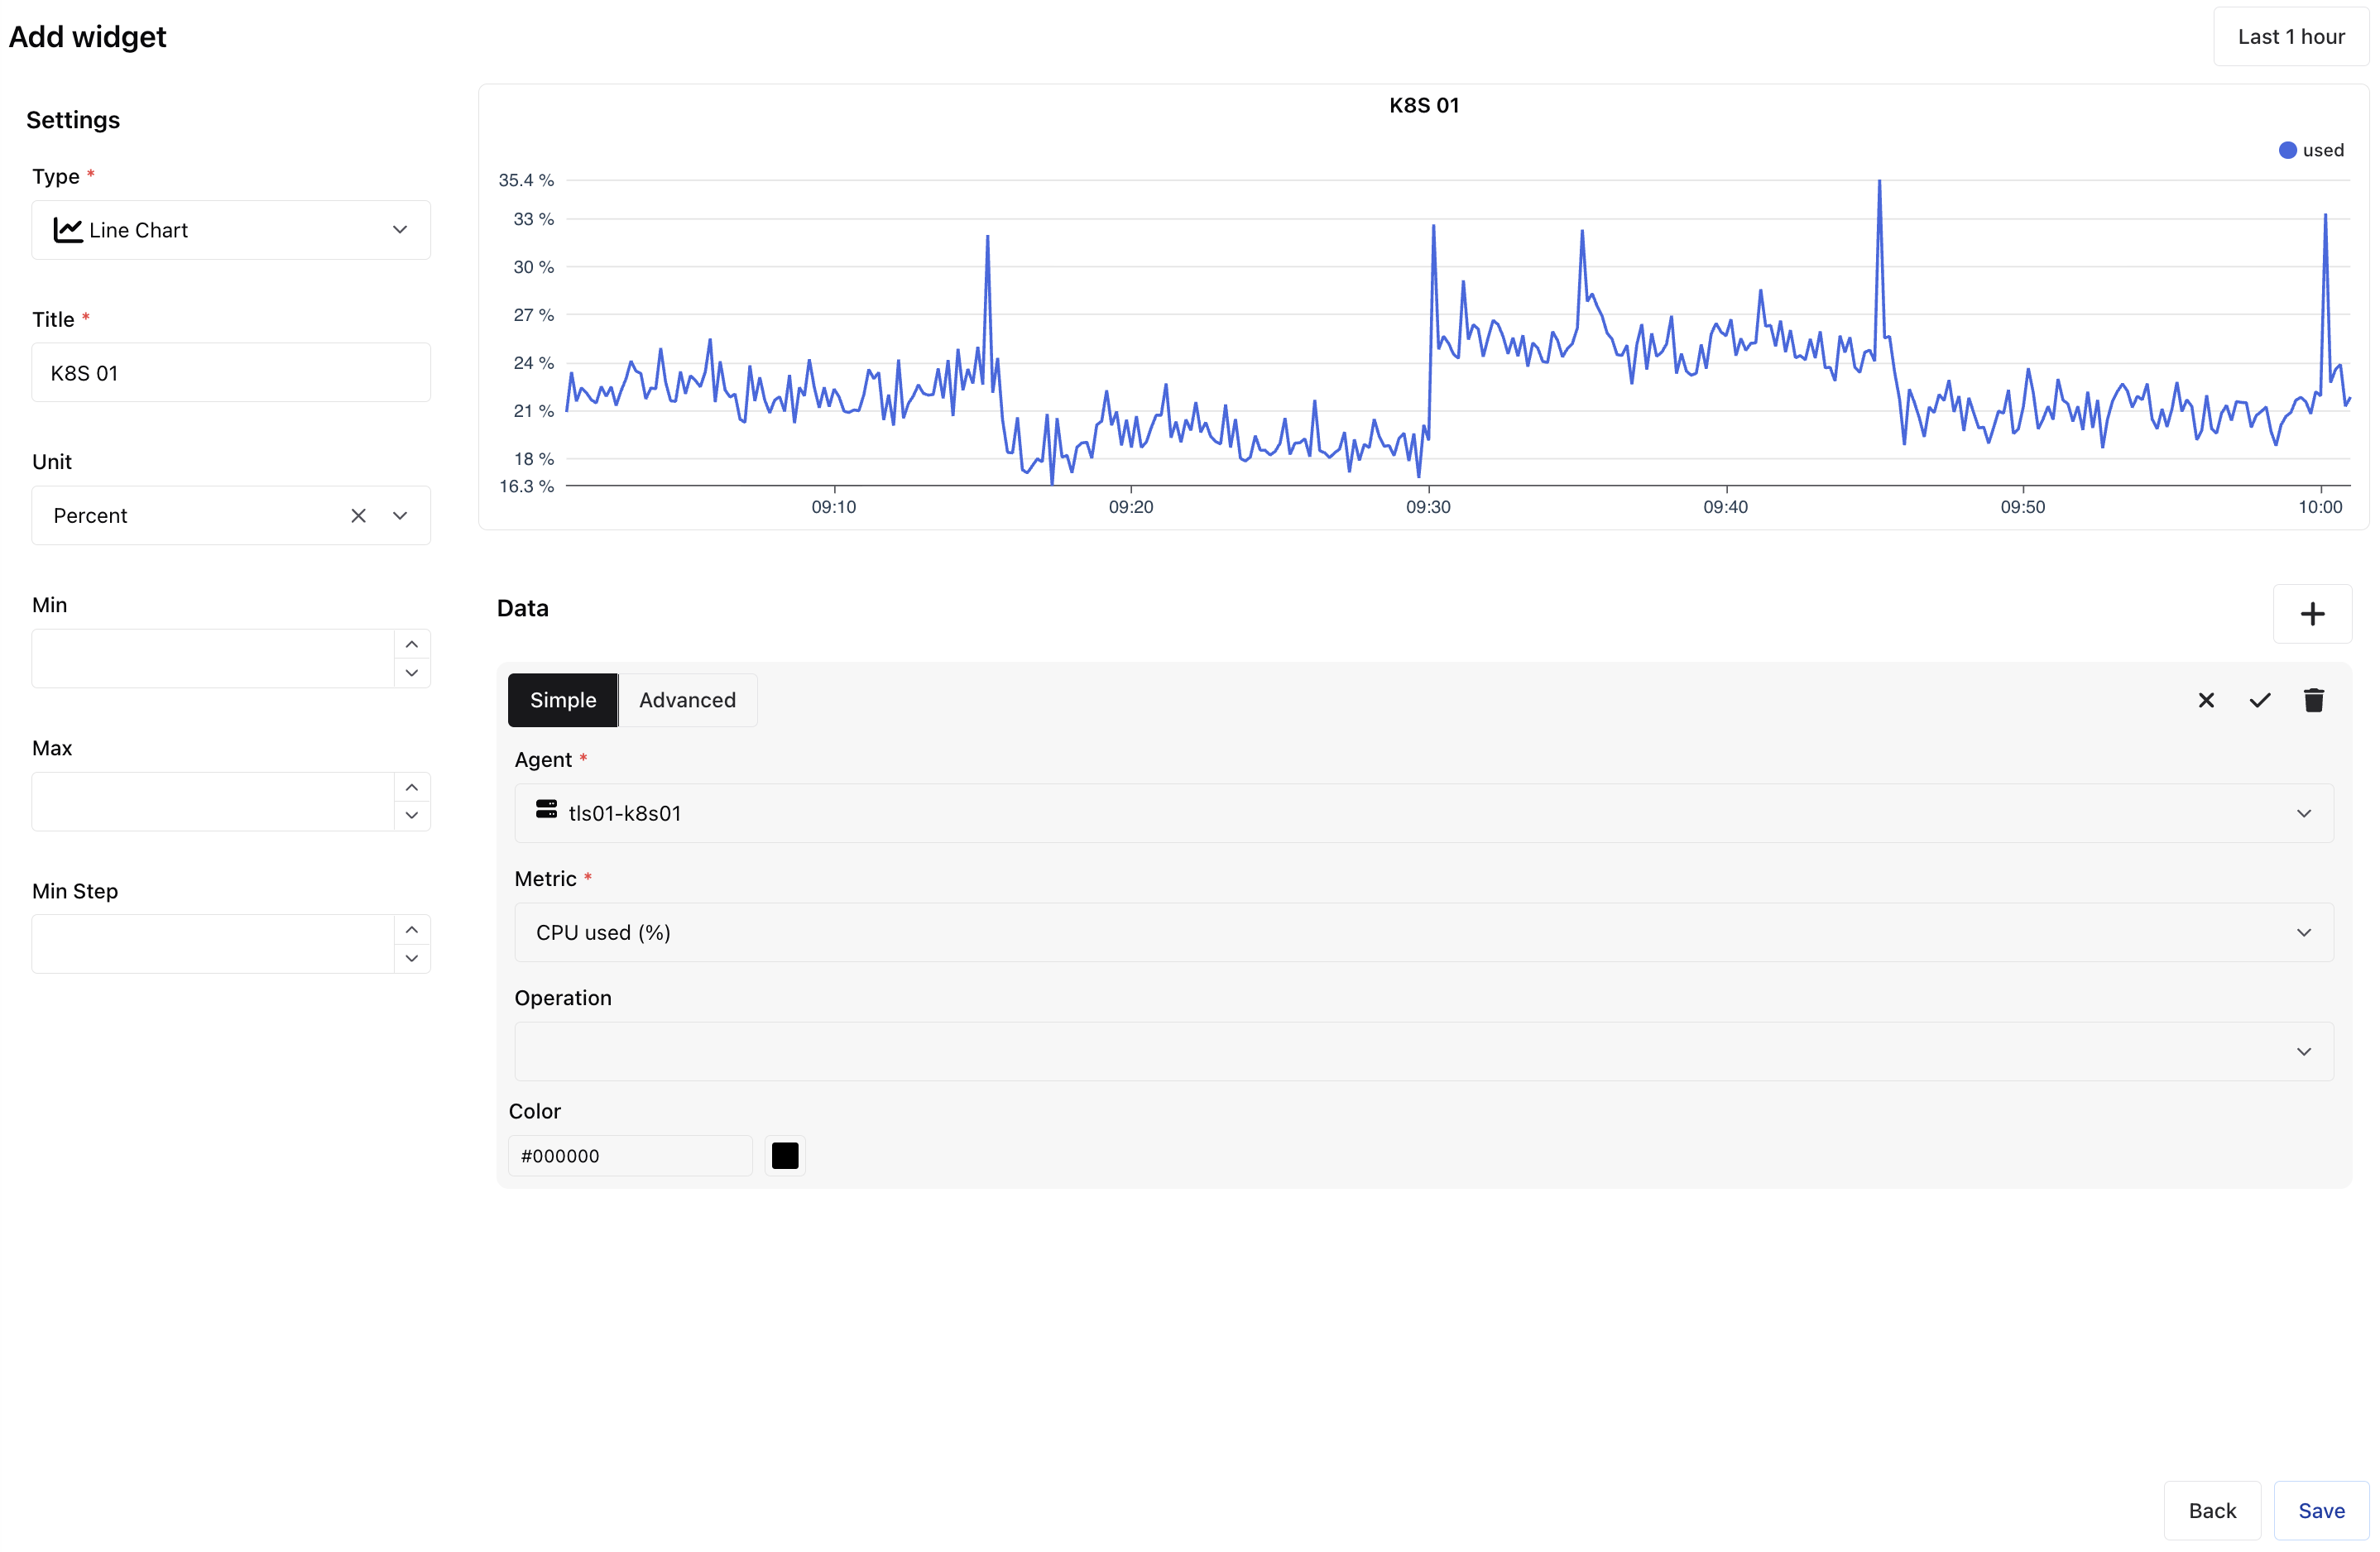
Section titled “Edit Dashboards”To edit a custom dashboard, you can use simple mode:
Or advanced mode with PromQL: