Annotations
Dashboard annotations can be used to mark a specific time range on Bleemeo dashboards. There are two types of annotation:
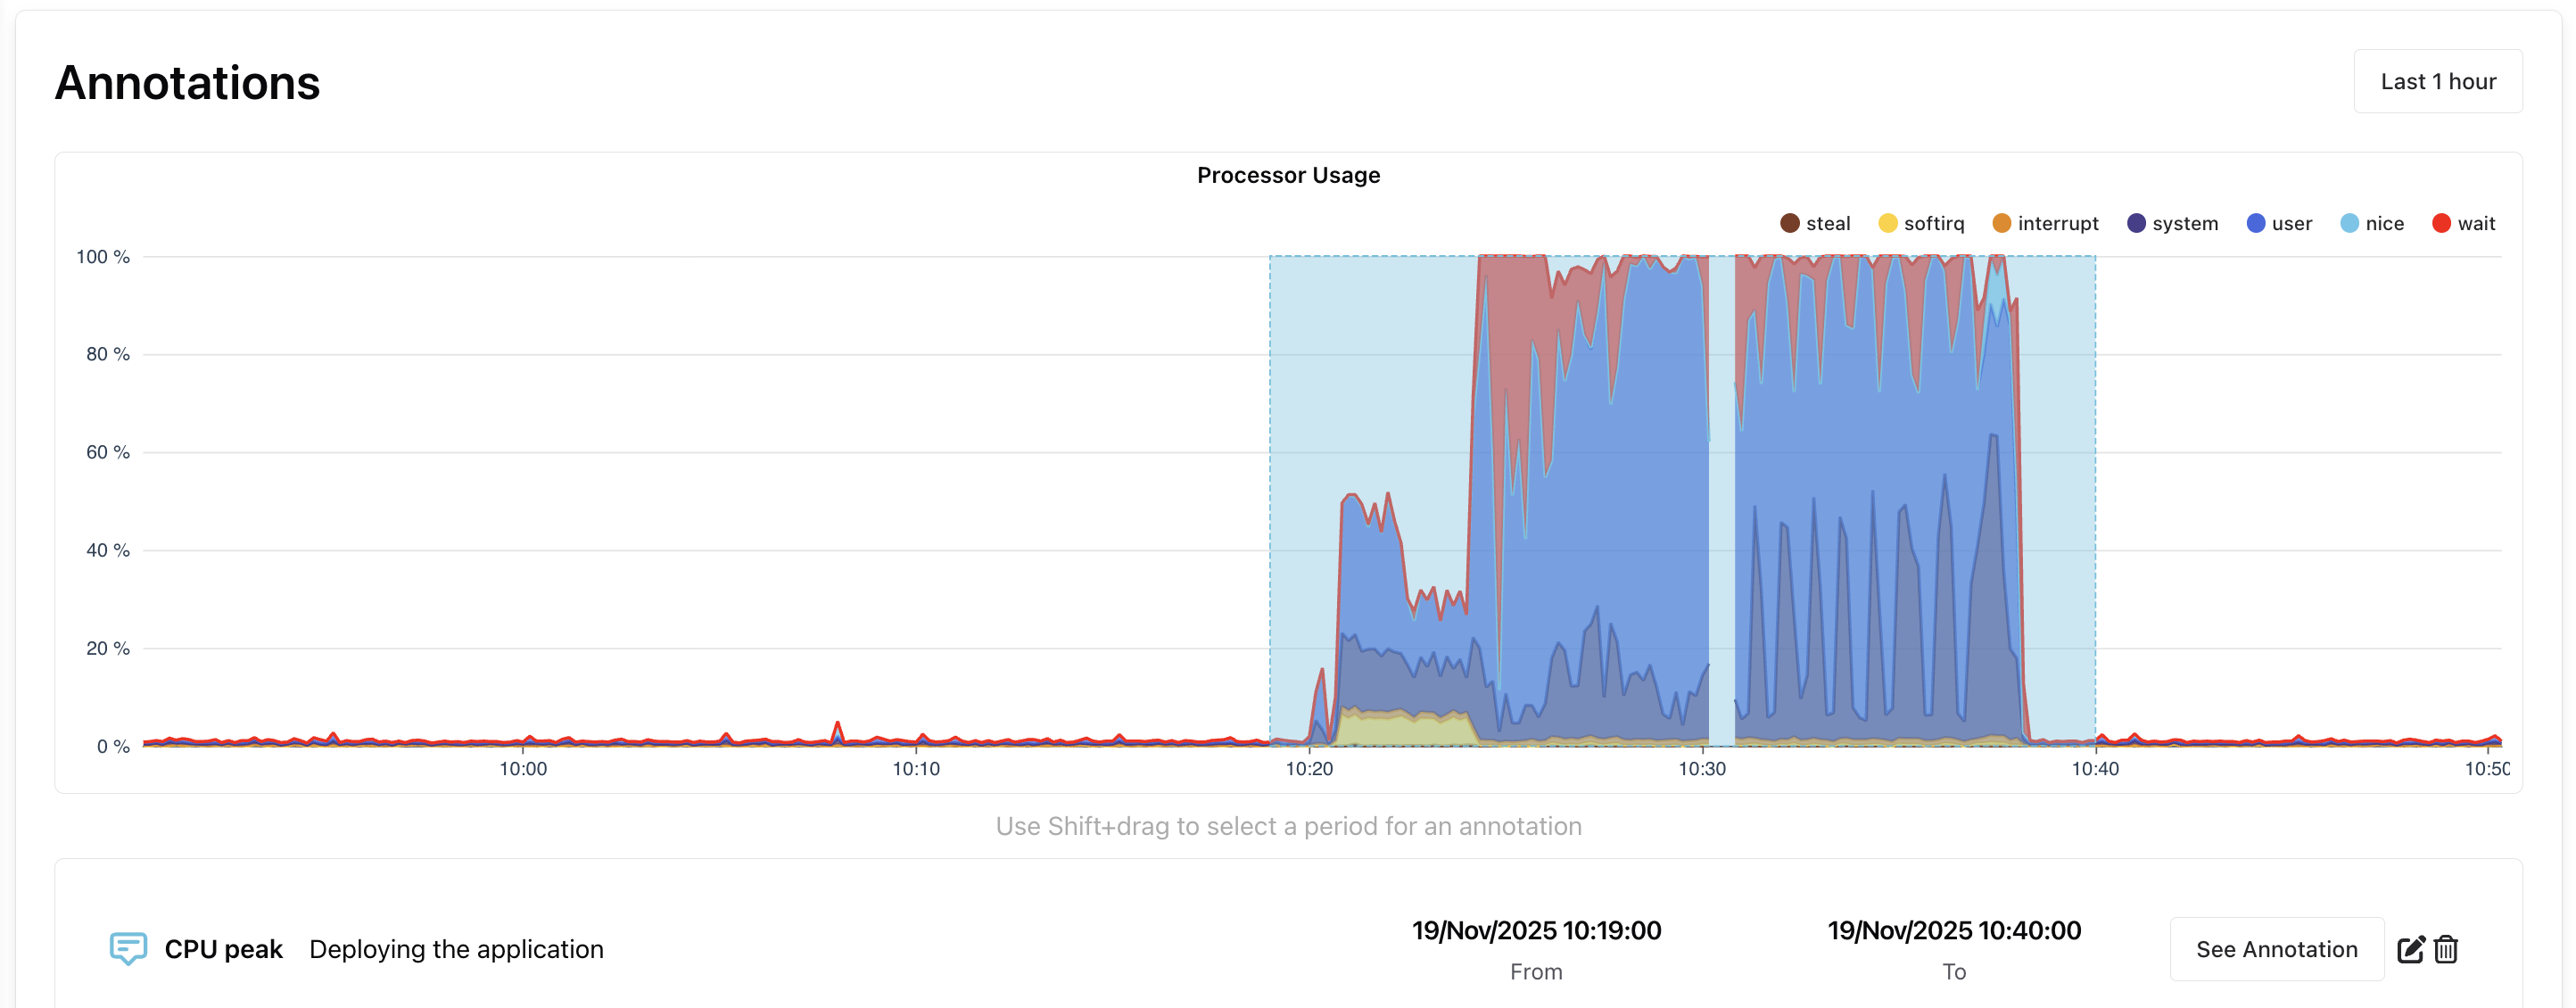
- User-created annotations: these let you mark a time range on the chart and add a description in the event of a problem.
- Annotations created automatically by our artificial intelligence when a metric value falls outside the predicted range.
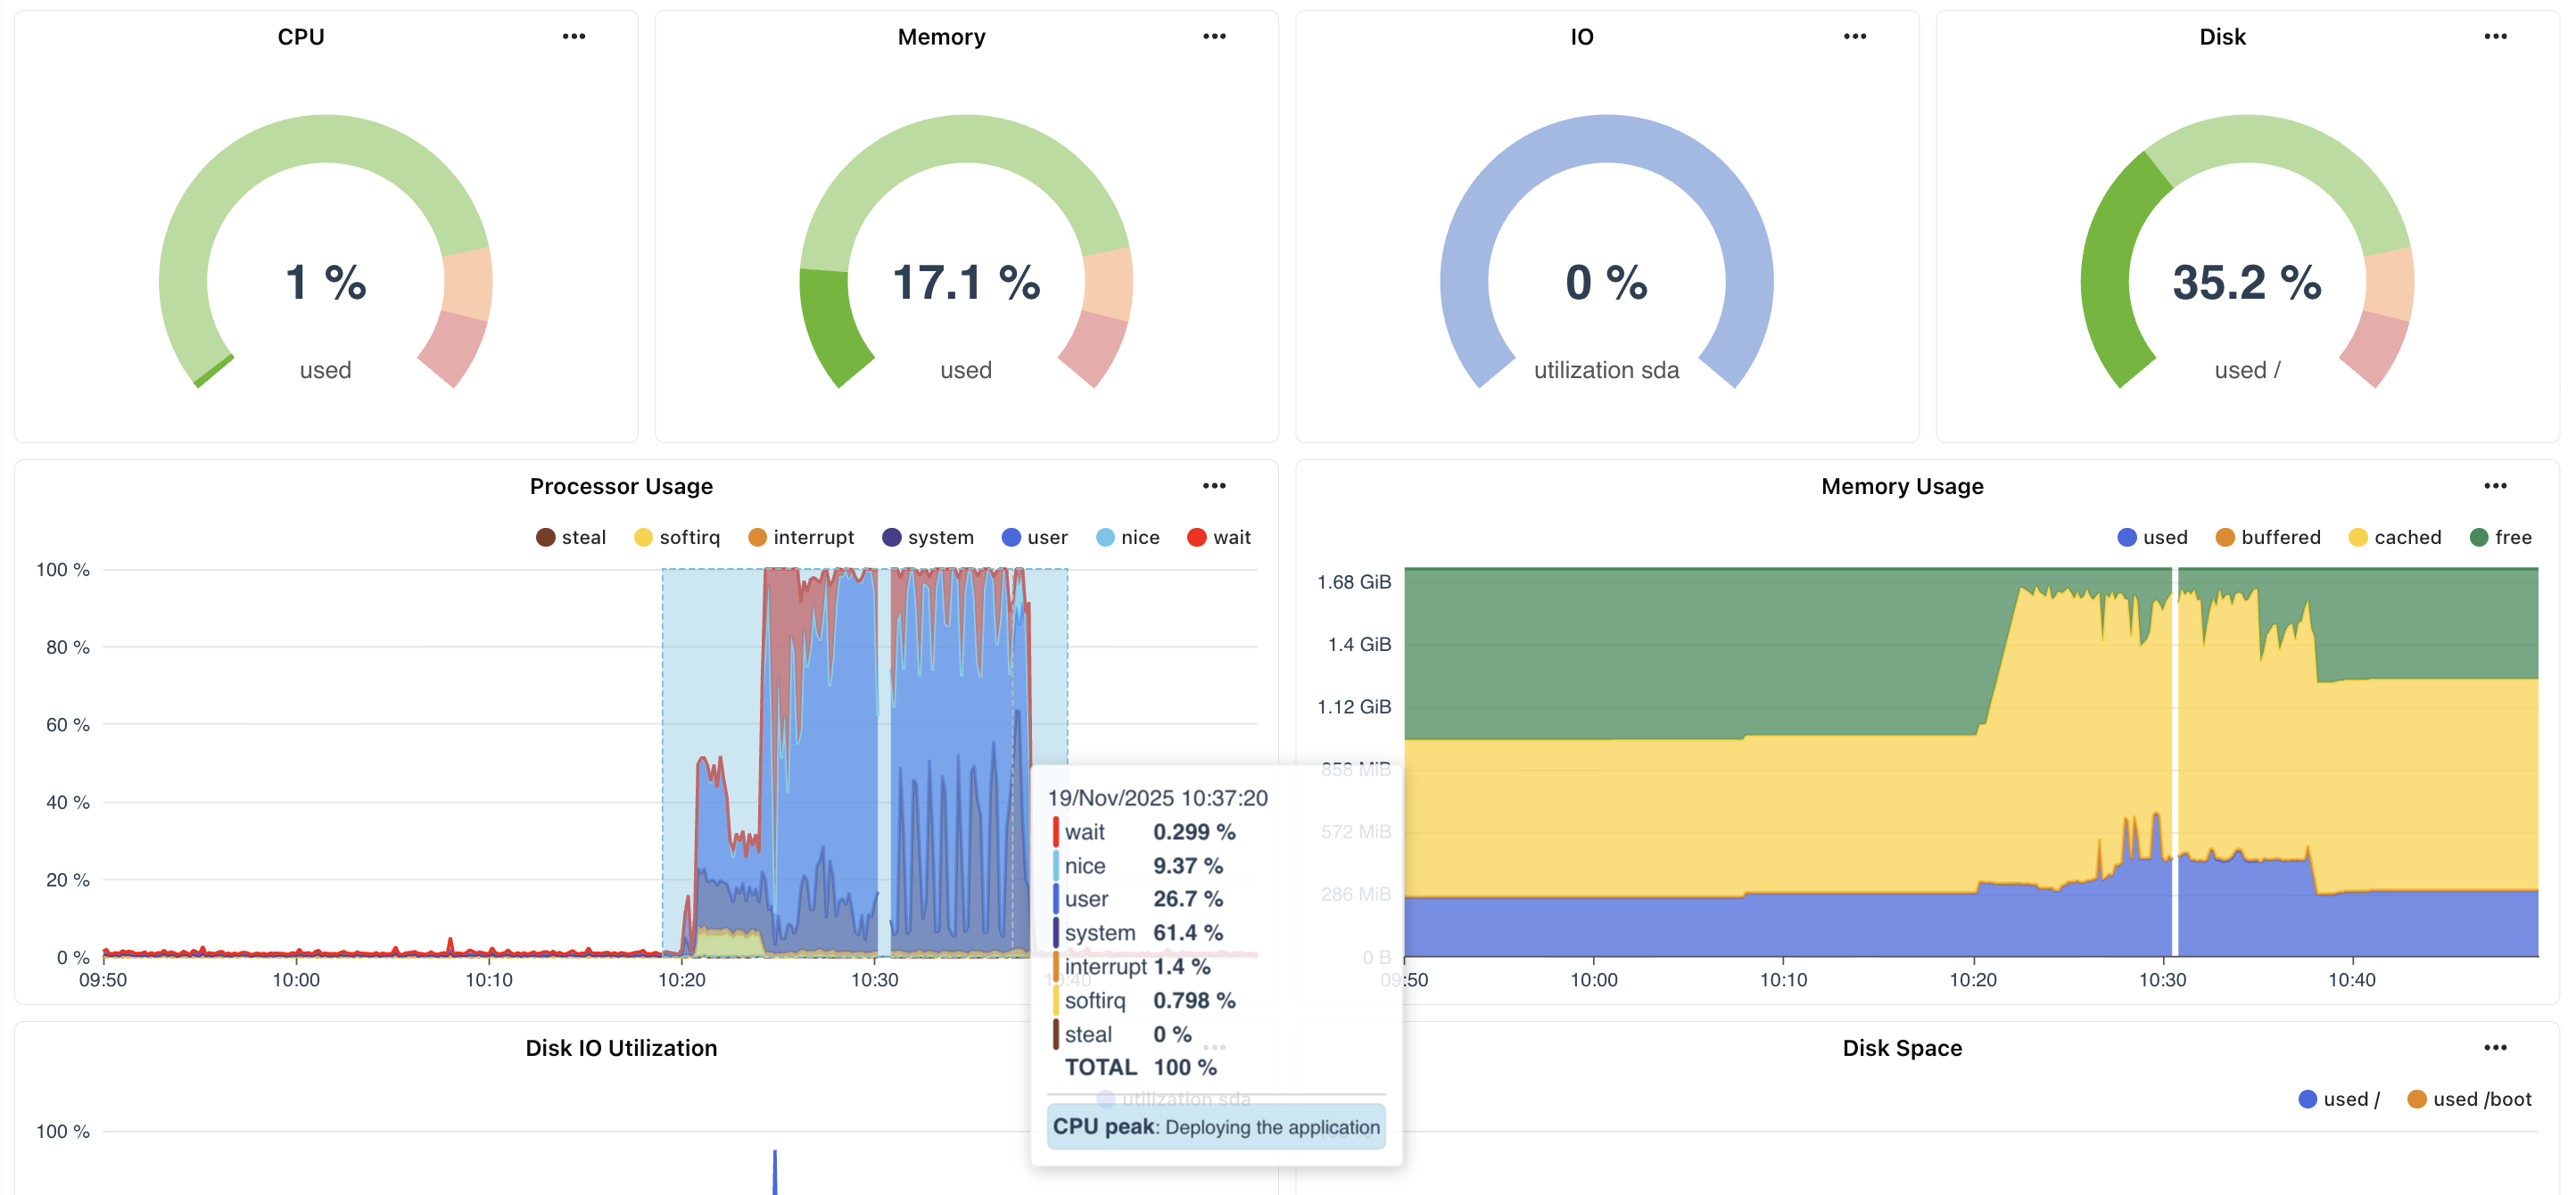
Annotations are displayed directly on the relevant widgets, and can be modified from those widgets.
You can create an annotation on any widget (line chart or stack chart) on a dashboard with Shift + left click.
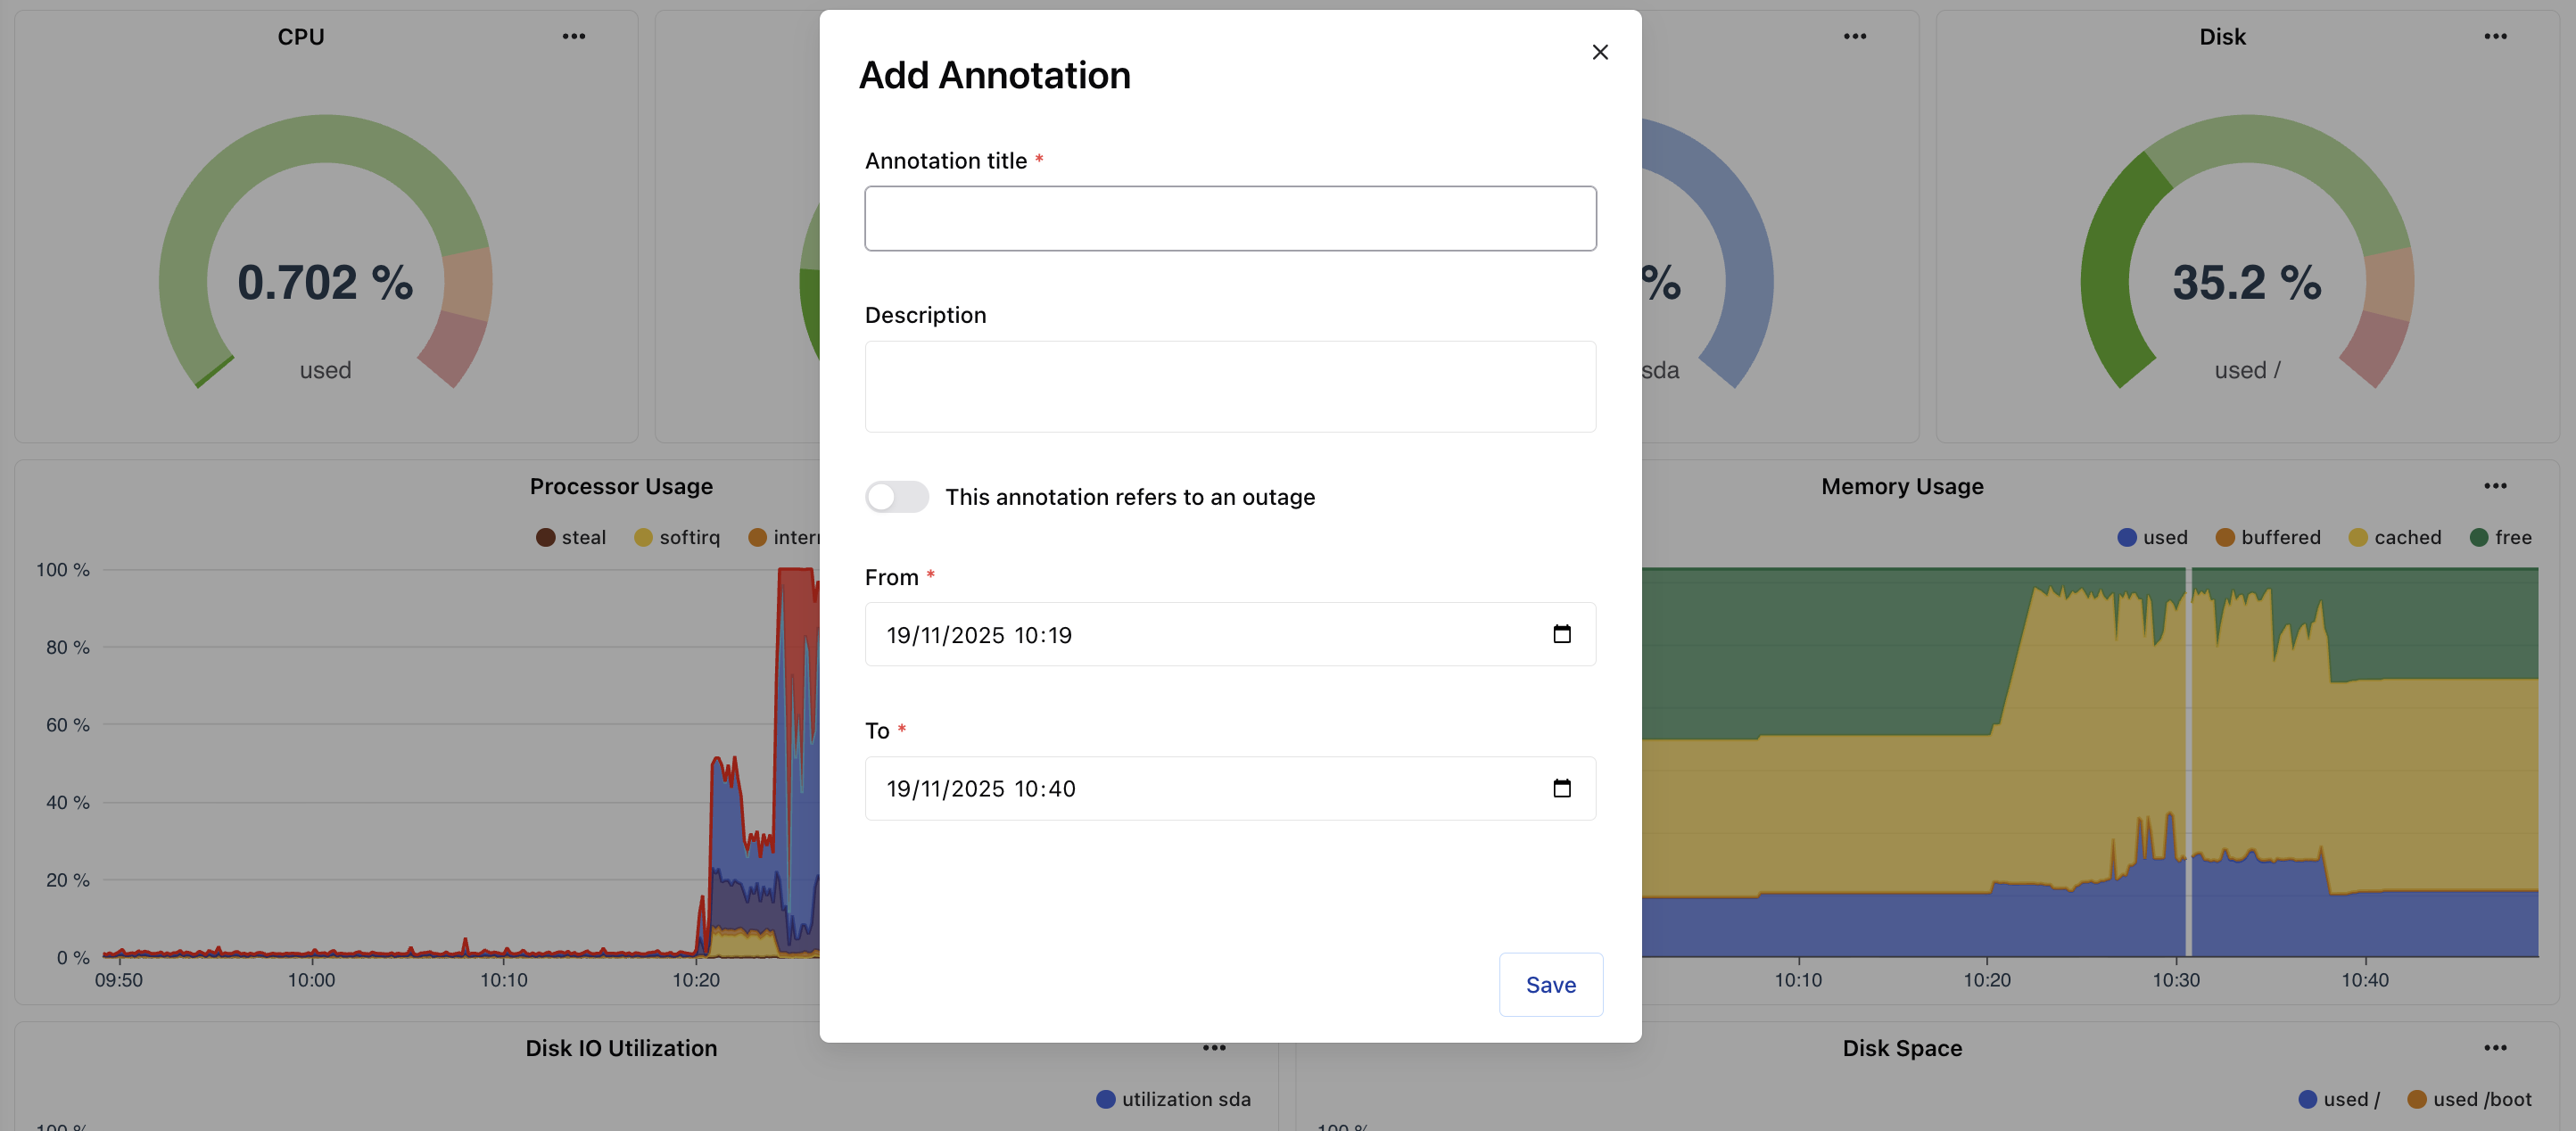
This opens a modal with several fields to fill in. The outage toggle only displays the annotation area in red on the graph (it has no other effect).
The annotation is linked to the widget, so you can only find it on the widget on which you created it.
If you click on ... on a widget, you can click on the annotations, which will give you a list of the annotations linked to this widget, with the option of modifying or deleting them.