Recording Rules
You can find documentation on Prometheus Query Language on the web:
Recording Rule creation with PromQL
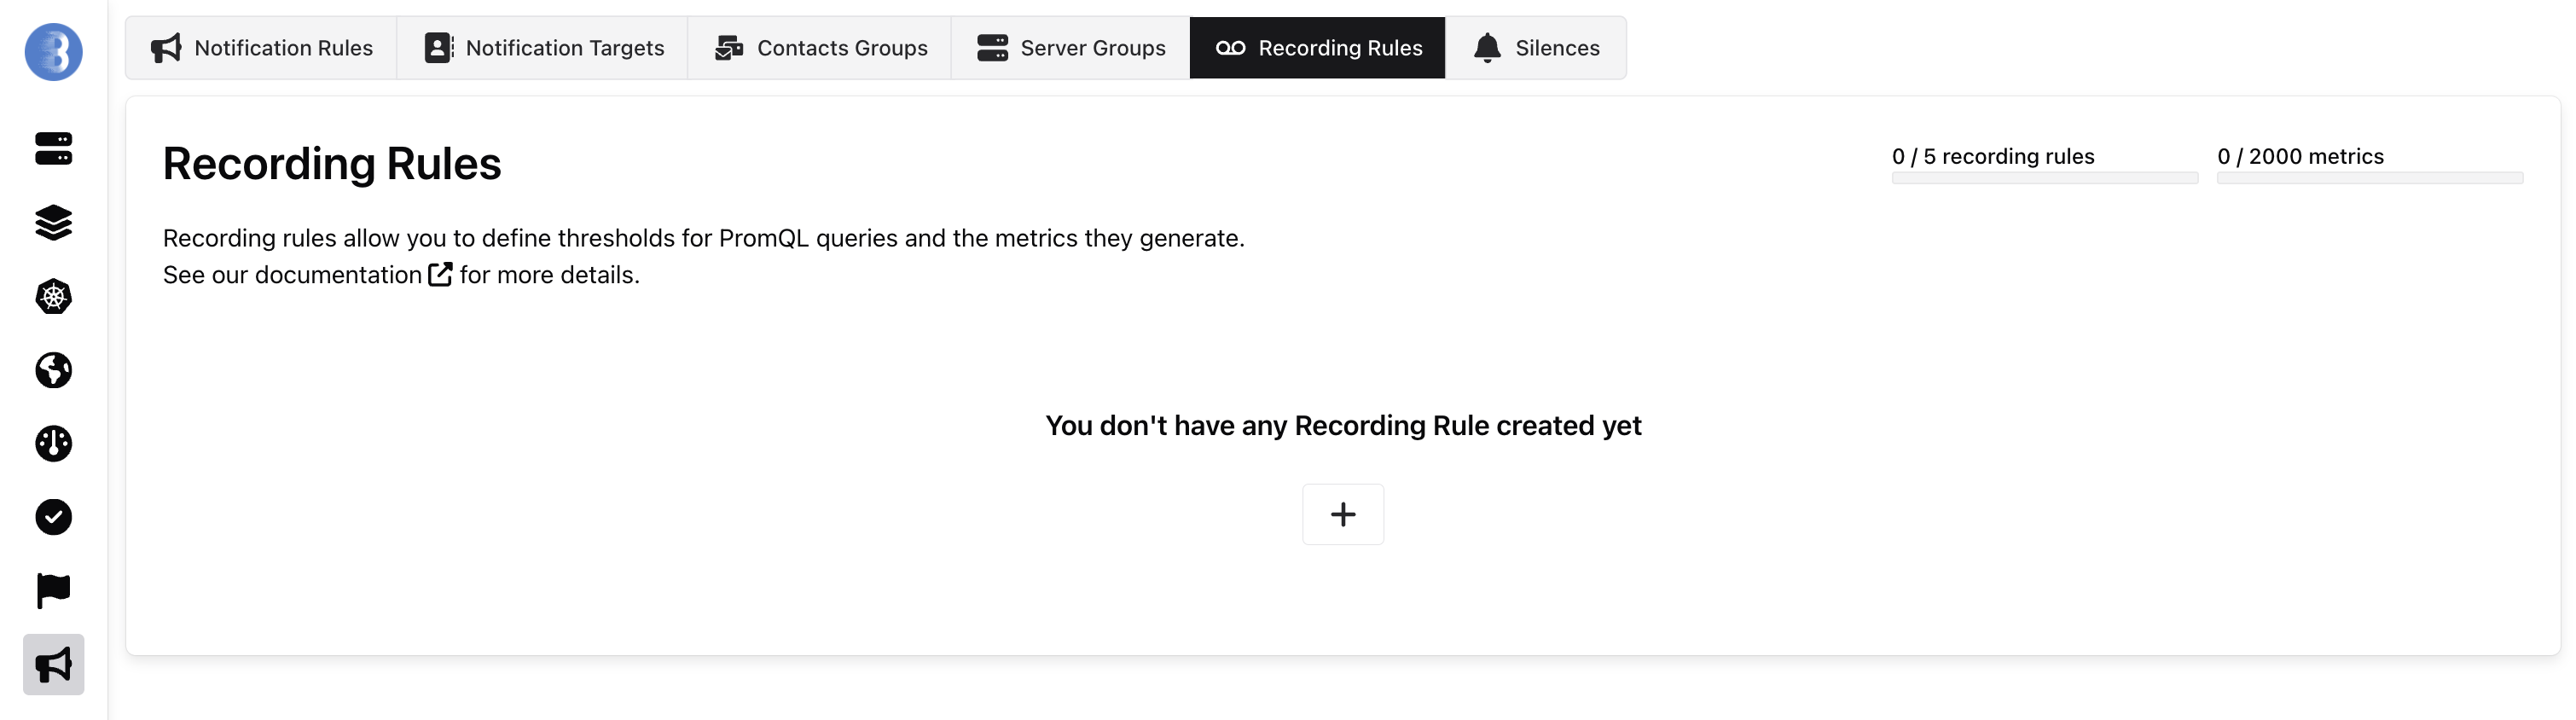
Section titled “Recording Rule creation with PromQL”To create a Recording Rule with PromQL, go to recording rule page and create a new recording rule.
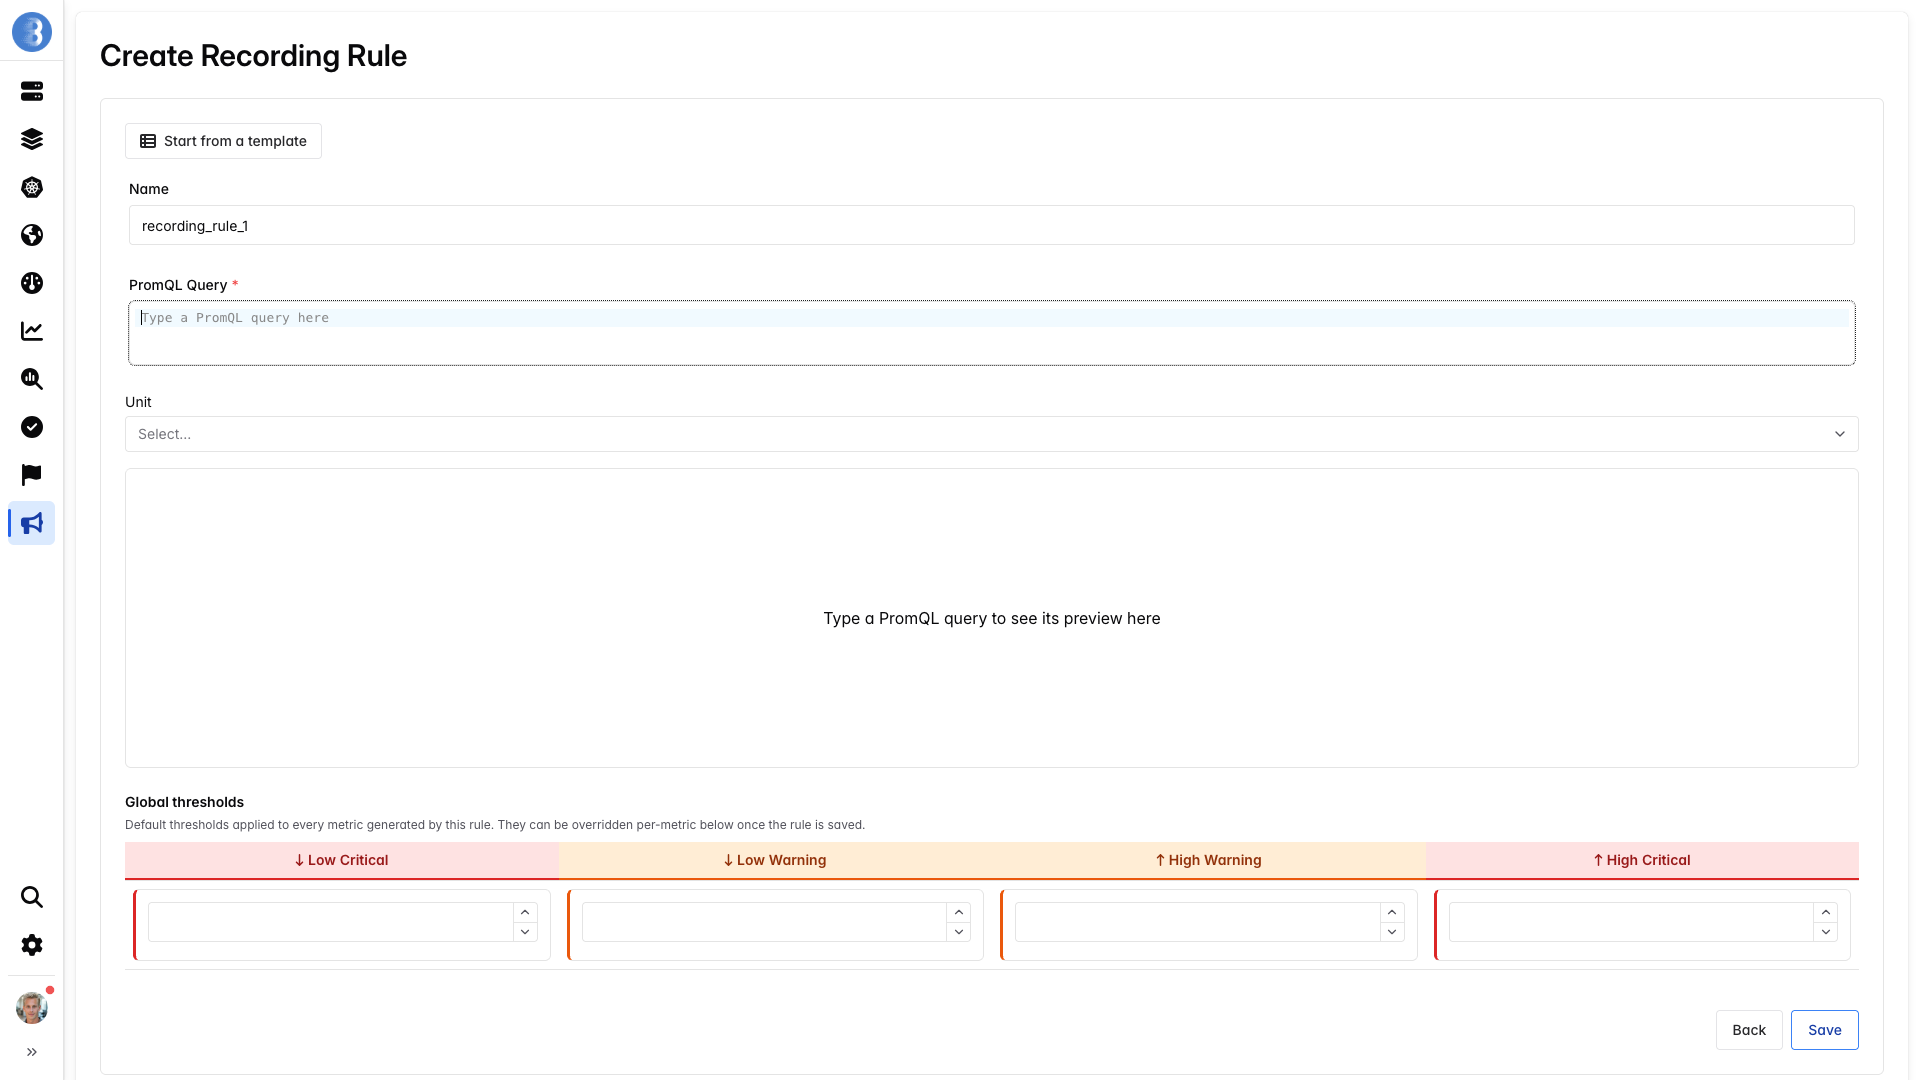
You can write your PromQL in the first part; if the PromQL is error-free, it will display the result in the graph, along with the number of metrics it generates at that moment.
You can add a warning and/or critical threshold and a name; this name will be used as the metric name in the status dashboard and notifications.
Example: Cassandra
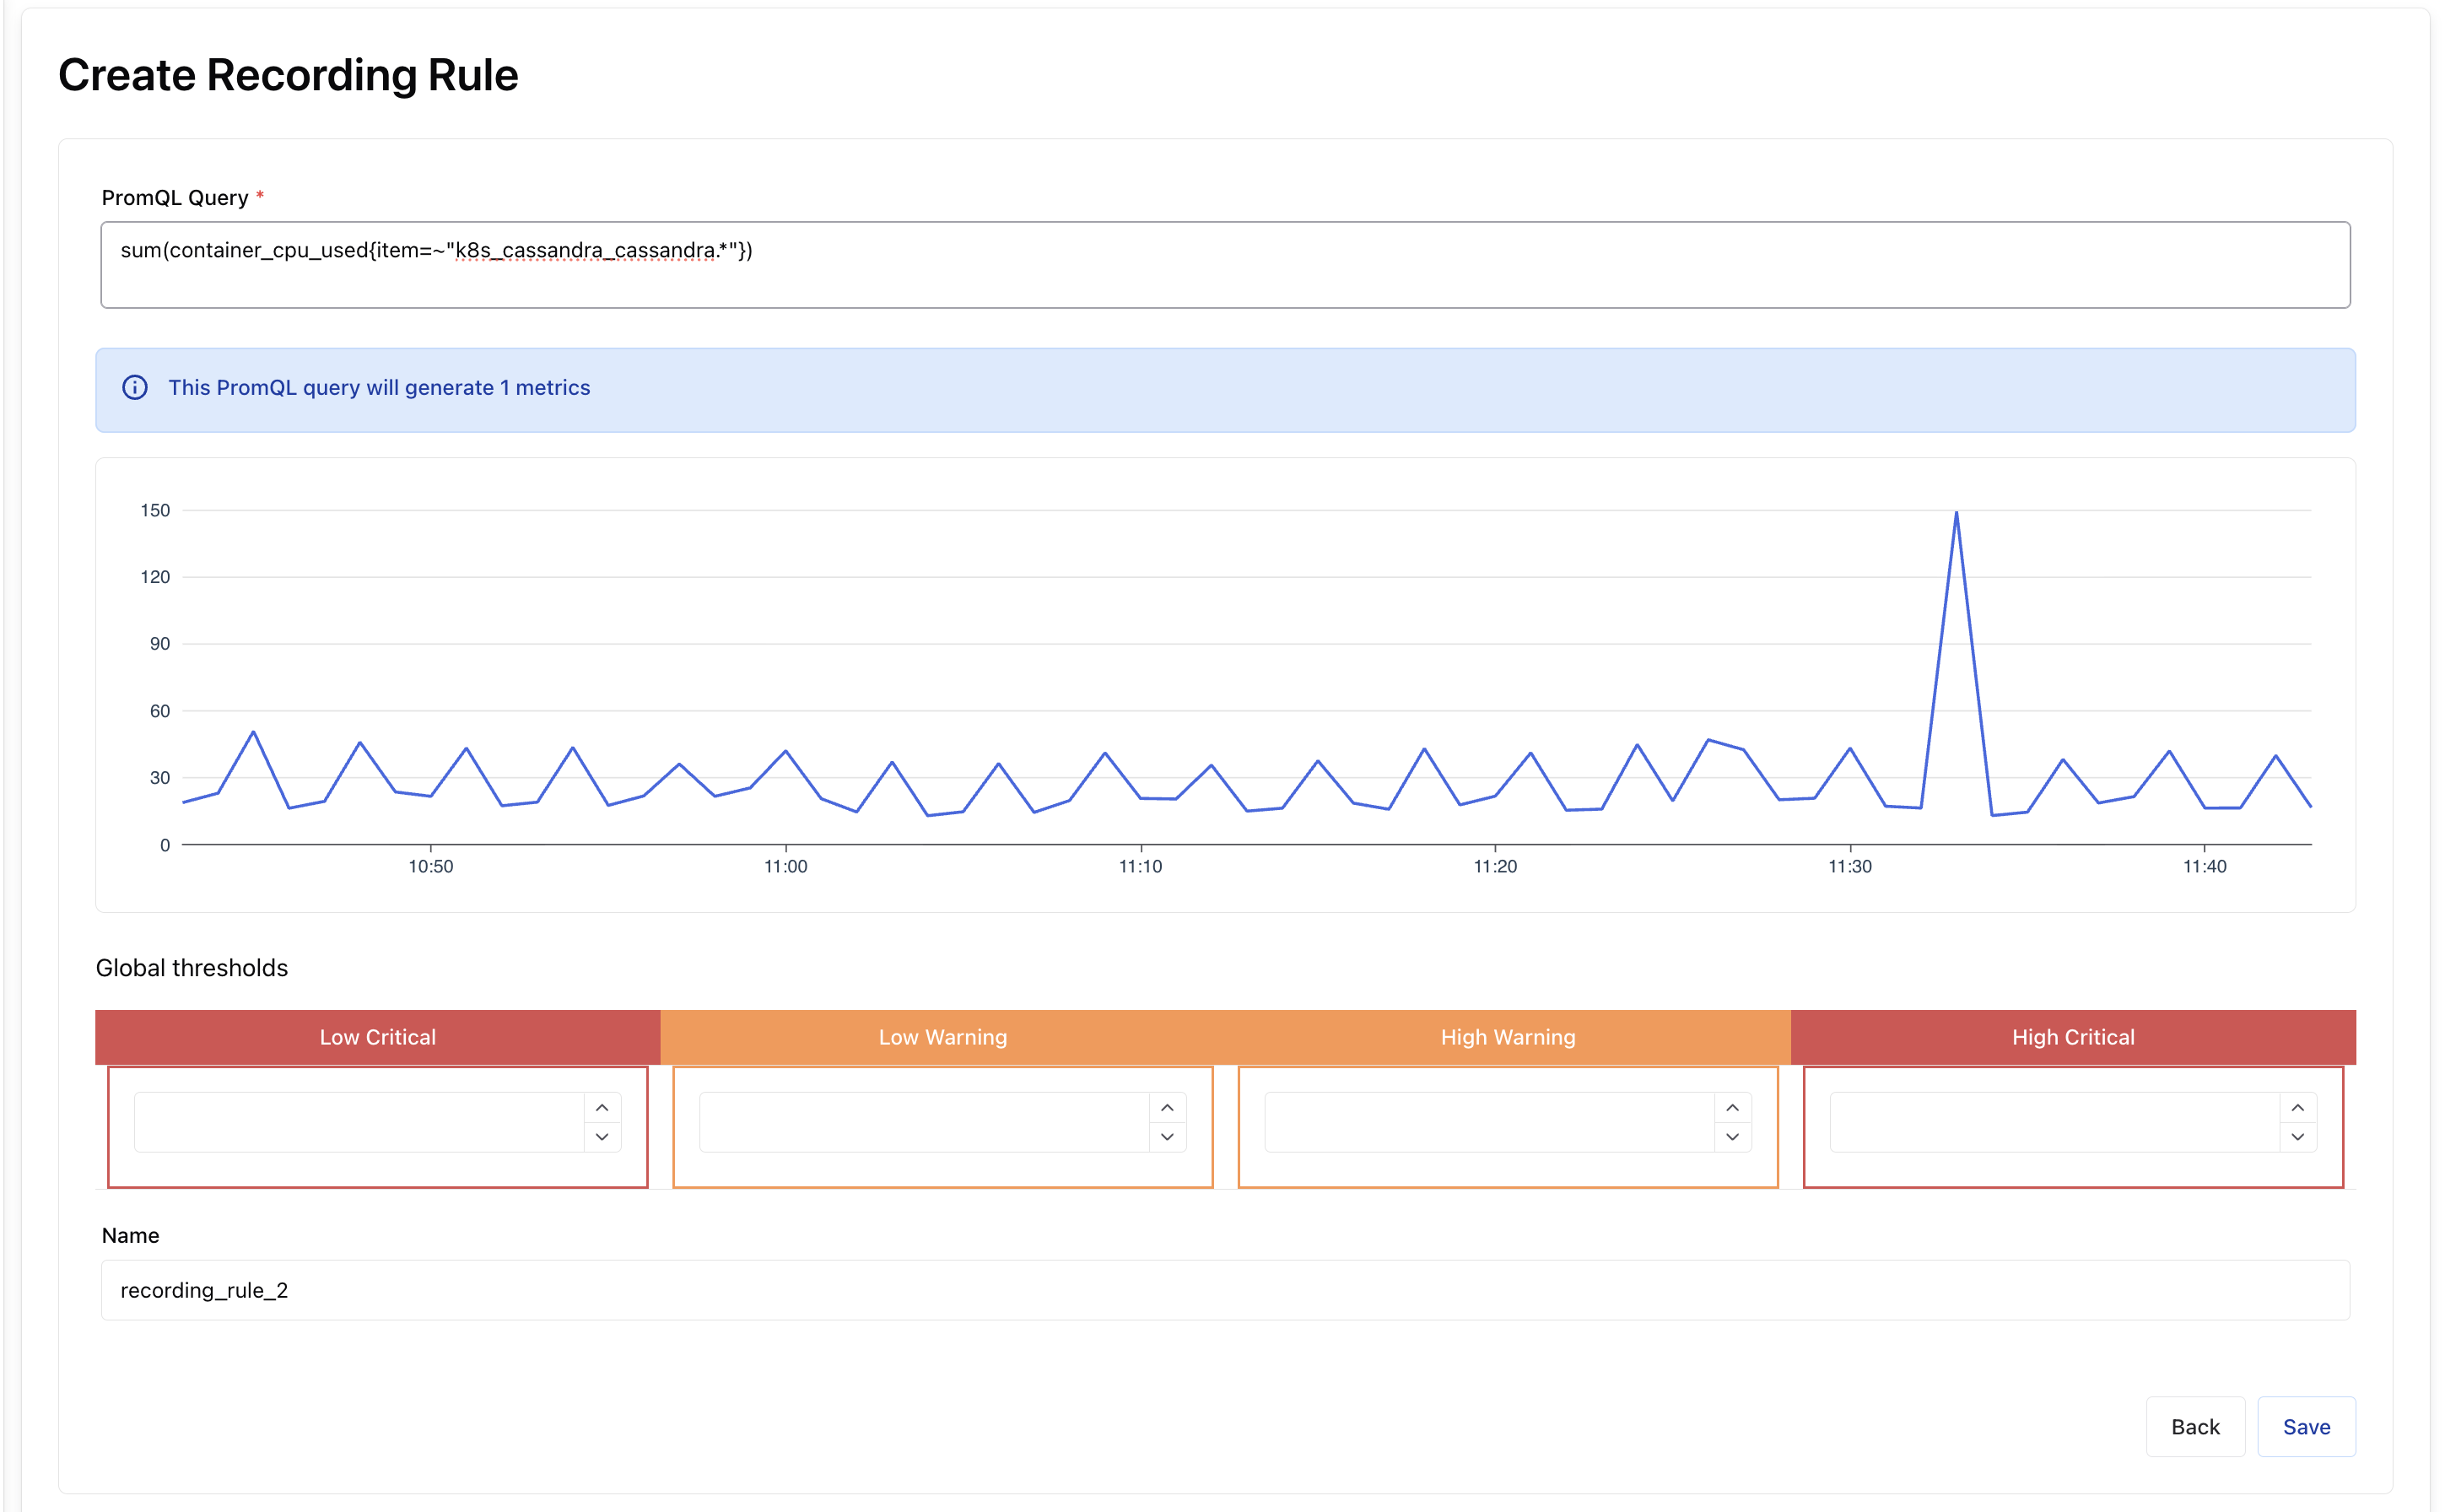
Section titled “Example: Cassandra”We have several Cassandra servers running on our Kubernetes, we want to generate one metric to add it to a dashboard and notify us when the sum of the containers’ CPU usage exceeds 50% (warning) and 60% (critical).
PromQL:
sum(container_cpu_used{item=~"k8s_cassandra_cassandra.*"})item=~"k8s_cassandra_cassandra.*" lets you find all the containers whose item name begins with k8s_cassandra_cassandra.