

Live Process Monitoring and Automatic Alert Snapshots
Beyond the aggregated key process metrics, Bleemeo
lets you inspect the complete, live process list of any monitored host — much like
running top or htop, but from your browser and with the full history of your fleet at
hand. When a CPU or memory alert fires, Bleemeo also captures a snapshot of that
process list automatically, so you can find out what was consuming the resources even
after the incident is over.
Accessing the process view
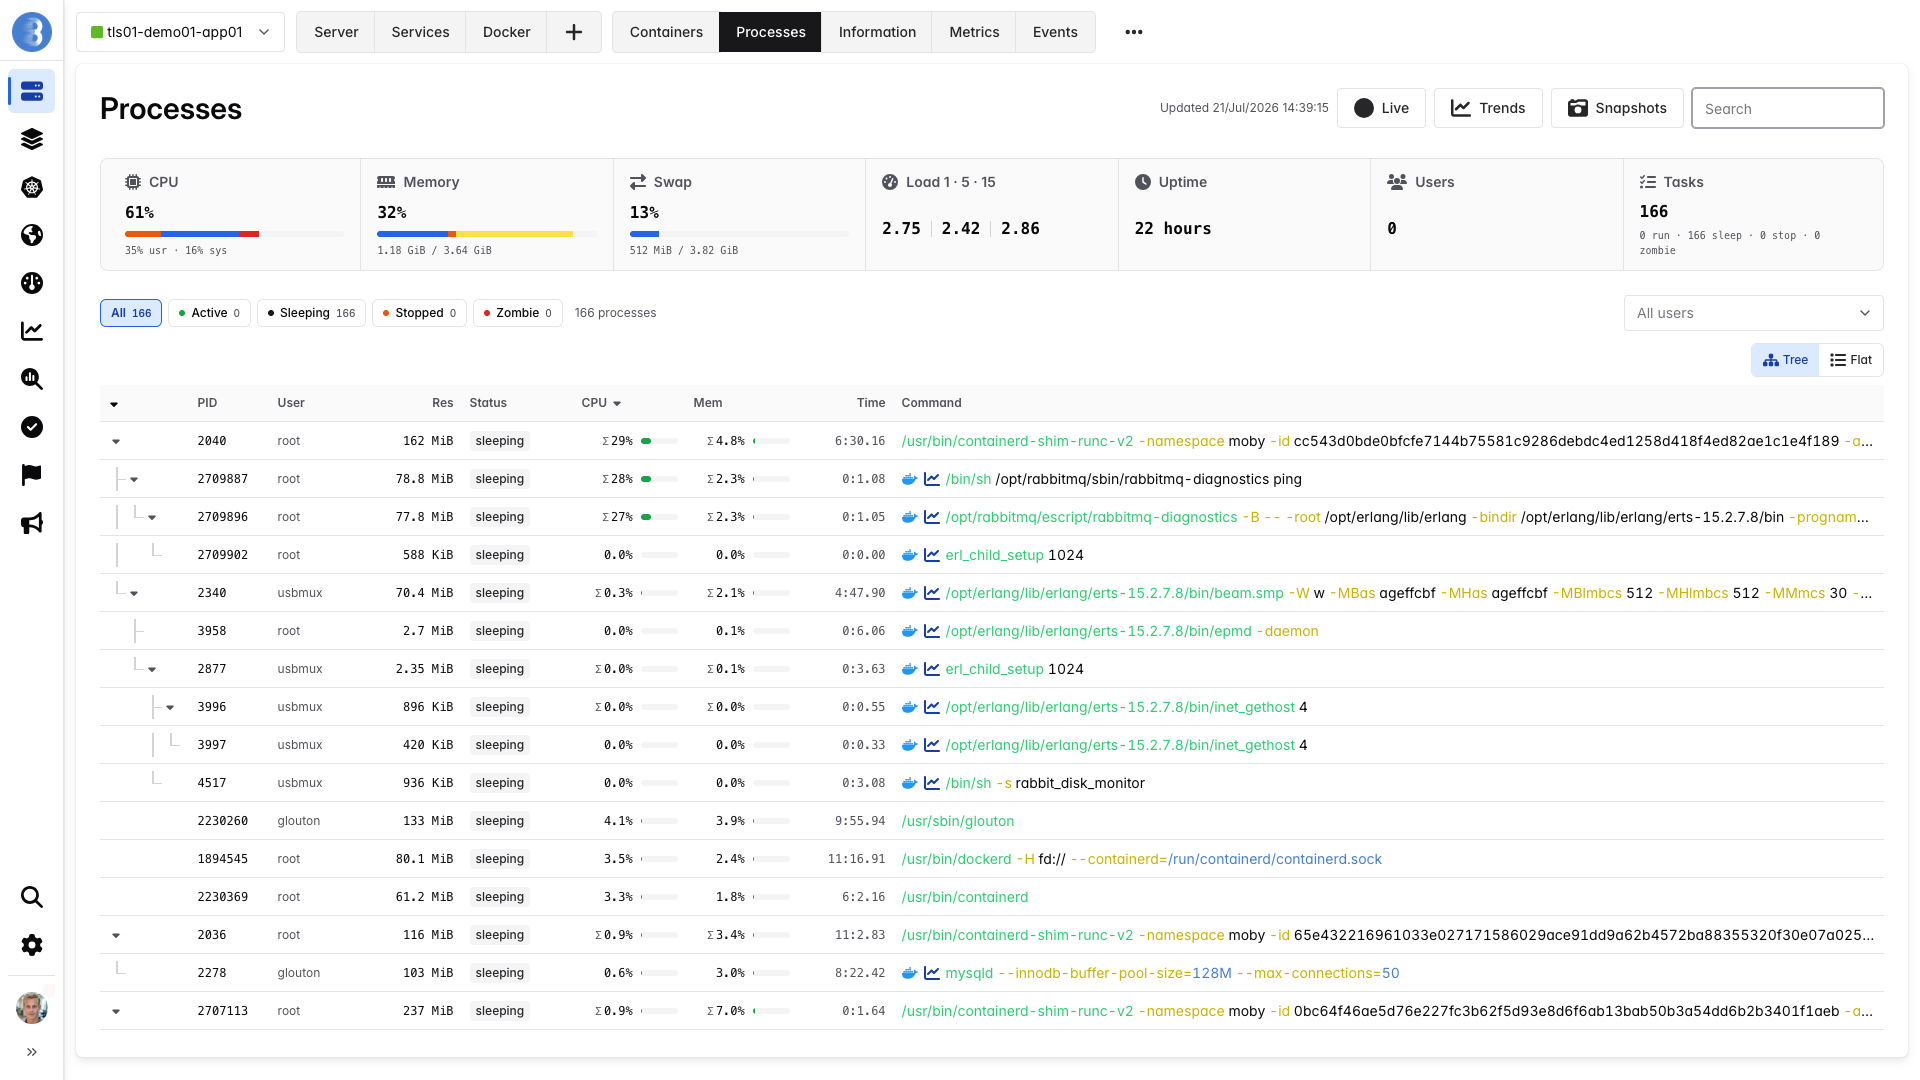
Section titled “Accessing the process view”From the agent list, open a host and select the Processes tab. The page shows every process reported by the Glouton agent on that host.
A stat strip at the top summarises the whole host at the moment the list was captured:
- CPU — total usage with a user / system / nice / iowait breakdown
- Memory — used / total, with buffers and cached
- Swap — used / total (shown only when swap is present)
- Load — 1, 5 and 15-minute load averages
- Uptime, Users and Tasks — with a running / sleeping / stopped / zombie count
Live and paused modes
Section titled “Live and paused modes”The list opens paused: it loads once and then freezes, so sorting, scrolling and opening details are not disrupted. Toggle Live to stream updates — the table then refreshes every 10 seconds and a countdown shows the time to the next refresh. Toggle it back to pause at any time.
You can display the processes as a flat list or as a tree that reflects the parent/child (PID/PPID) relationships between processes.
Columns
Section titled “Columns”| Column | Description |
|---|---|
| PID | Process identifier |
| User | User the process runs as |
| Res | Resident memory (RSS) used by the process |
| Status | Running, sleeping, stopped or zombie |
| CPU | CPU usage in percent |
| Mem | Memory usage in percent |
| Time | Total CPU time consumed |
| Command | Process name and full command line |
Processes running inside a container are flagged with their runtime icon (Docker, containerd, …) and link to the corresponding container view. Processes that belong to a discovered service link to that service’s metrics.
Filtering
Section titled “Filtering”To find a process quickly you can:
- Search by name or command line
- Filter by status (running, sleeping, stopped, zombie)
- Filter by user
Trends
Section titled “Trends”The Trends panel opens historical charts of the host’s process metrics over time.
These are the same process_* metrics described in
Key Process Metrics, useful to correlate a spike seen
in the live list with its evolution over the last hours or days.
Process snapshots
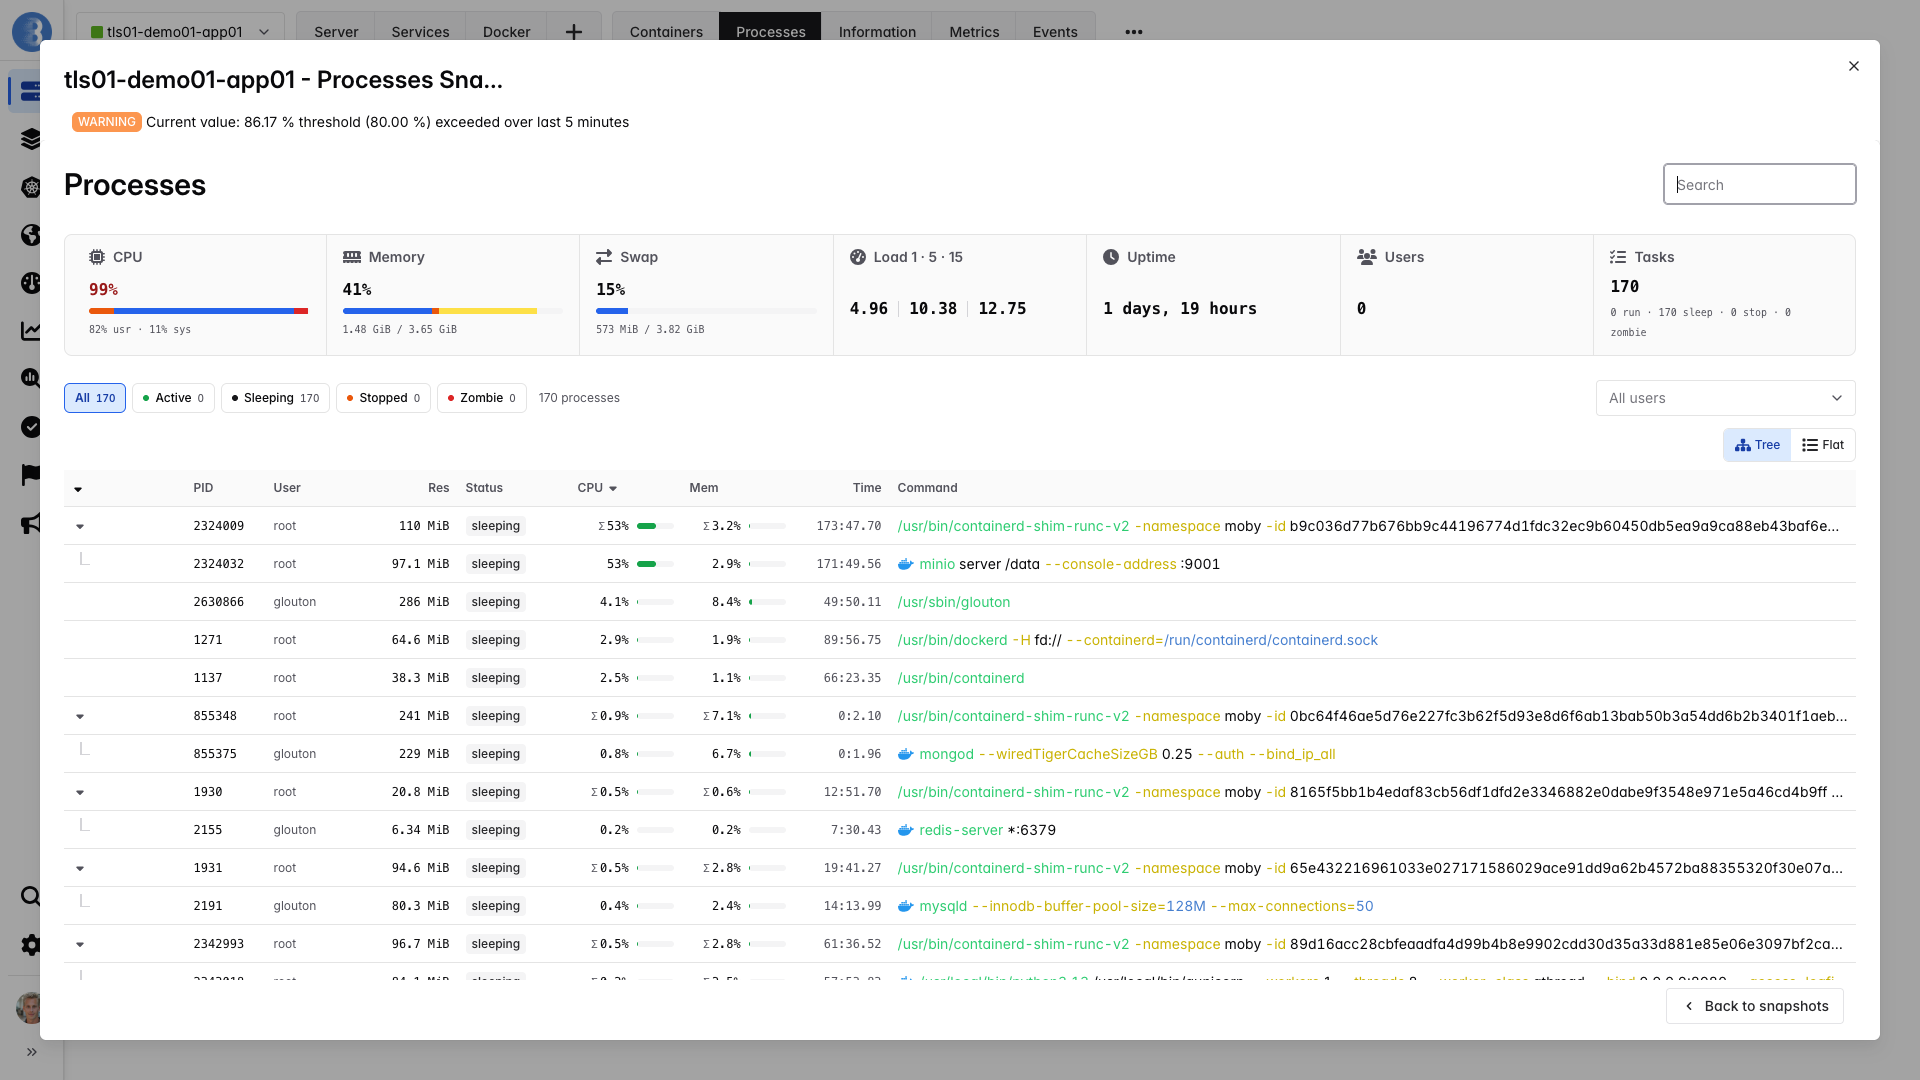
Section titled “Process snapshots”A snapshot is an automatic capture of the full process list, taken by Bleemeo when a CPU or memory alert fires on the host. It freezes exactly what was running — and how much CPU and memory each process was using — at the instant the alert triggered.
This is invaluable for post-mortem analysis: a memory or CPU alert often clears before you can connect to the host, leaving nothing to look at. With snapshots, you can open the alert afterwards and see precisely which process was responsible.
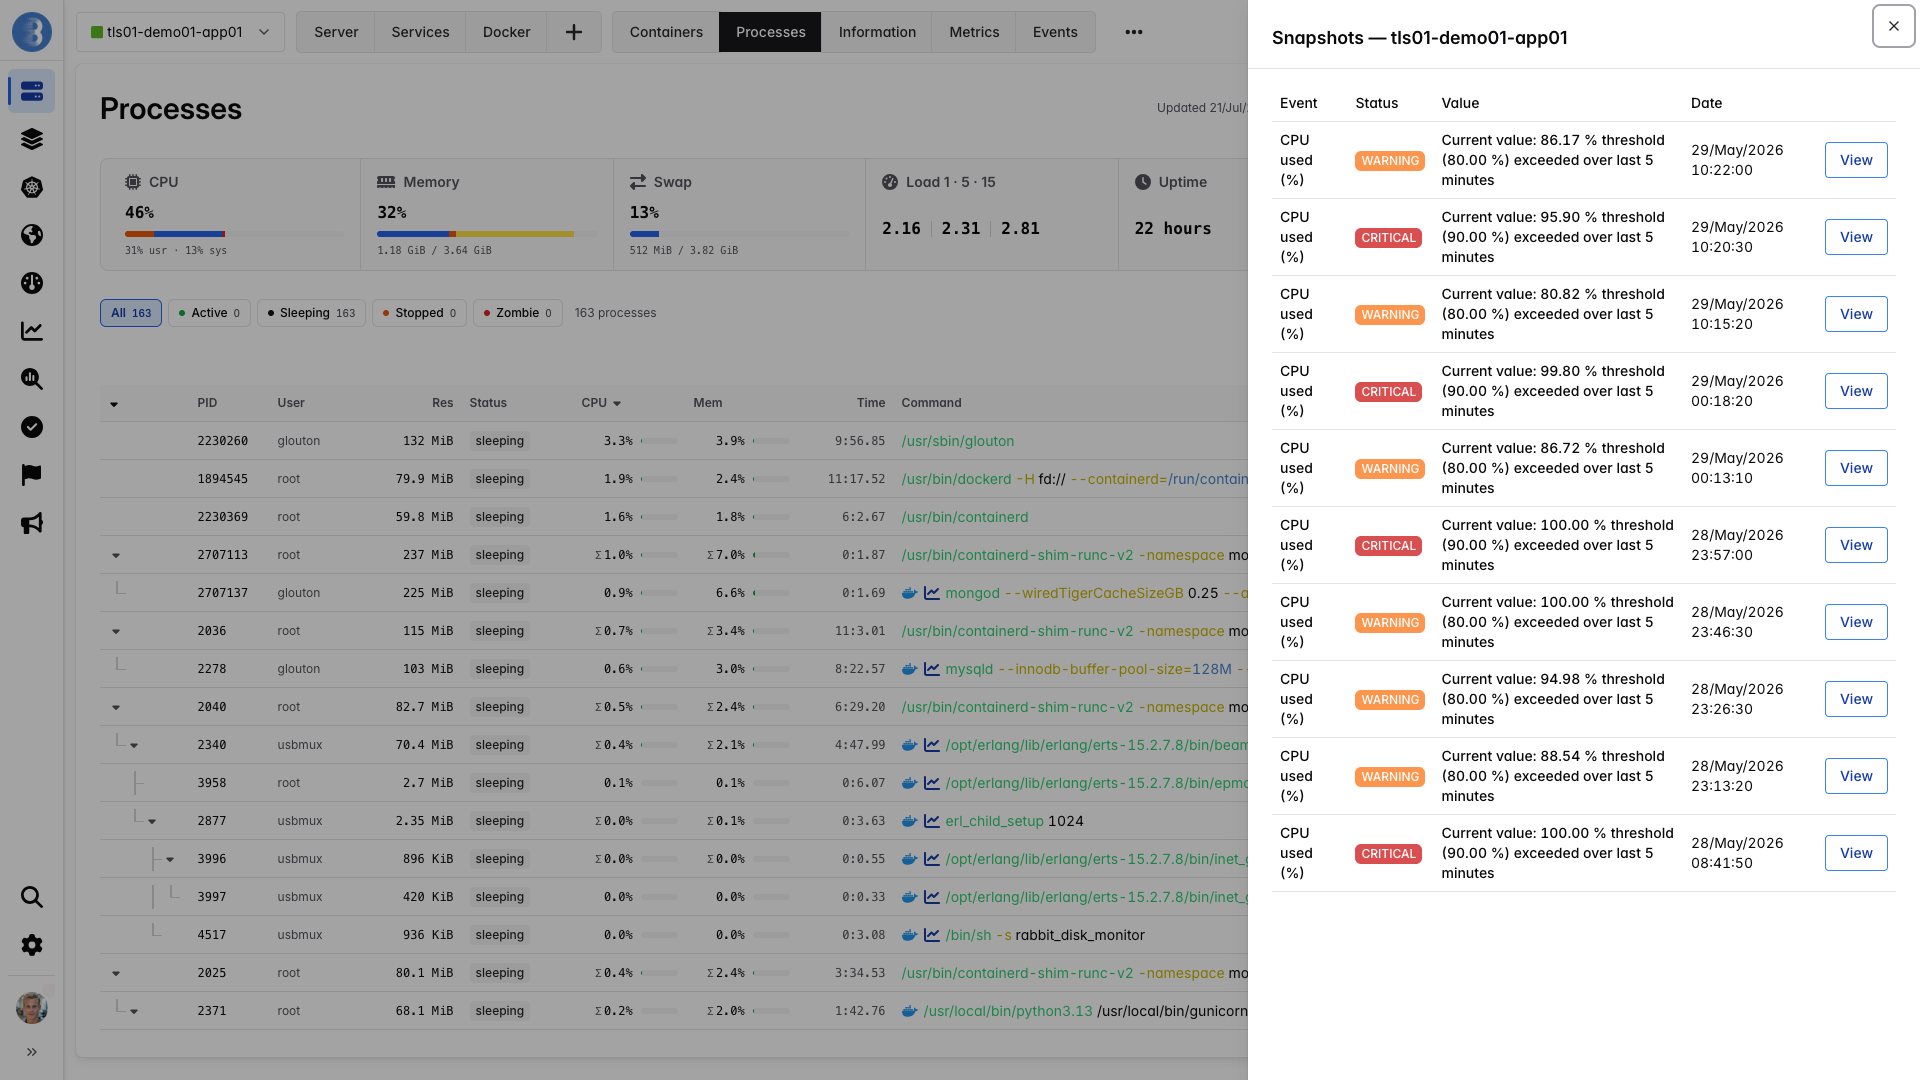
To review snapshots for a host, open its Processes tab and click Snapshots. The list shows every alert that produced a snapshot, with:
- the metric that triggered the alert (CPU or memory)
- the alert status (warning or critical)
- the recorded value
- the date and time it happened
Select View on any entry to open the captured process list, presented exactly like the live view — sortable and searchable — but frozen at the moment of the alert.
Disabling process collection
Section titled “Disabling process collection”Collecting process information has a small impact on the agent’s CPU usage. If you do not
need the process view and want to save some CPU cycles, you can disable process gathering
by adding the following to /etc/glouton/conf.d/99-local.conf:
agent: process_exporter: enable: false