Notifications
Integrations
Section titled “Integrations”The integrations page allows you to create new integrations and modify or delete existing ones.
Create Integration
Section titled “Create Integration”You can create a new integration with the + Integration button. The first thing to do when creating a new integration is to select the type of integration you need:
- Bleemeo Mobile application
- MessageBird (SMS)
- OpsGenie
- PagerDuty
- Slack
- Microsoft Teams Workflows
- Twilio (SMS)
- VictorOps
- Webhook
- OVH SMS
- Telegram
- Slack Webhook
Finally, you need to enter the name of your integration, which will be used to create a notification rule. If you want to create a new notification rule with this integration, go to the notifications page. Once done click the Create button. Your new integration is added at the end of the list. It is enabled by default.
Actions on Integration
Section titled “Actions on Integration”You can enable or disable an integration with the toggle button. The two small icons on the right let you edit or delete an integration.
On this page you can see the notifications that you have configured.
Bleemeo creates a default notification that notifies you by email of all errors.
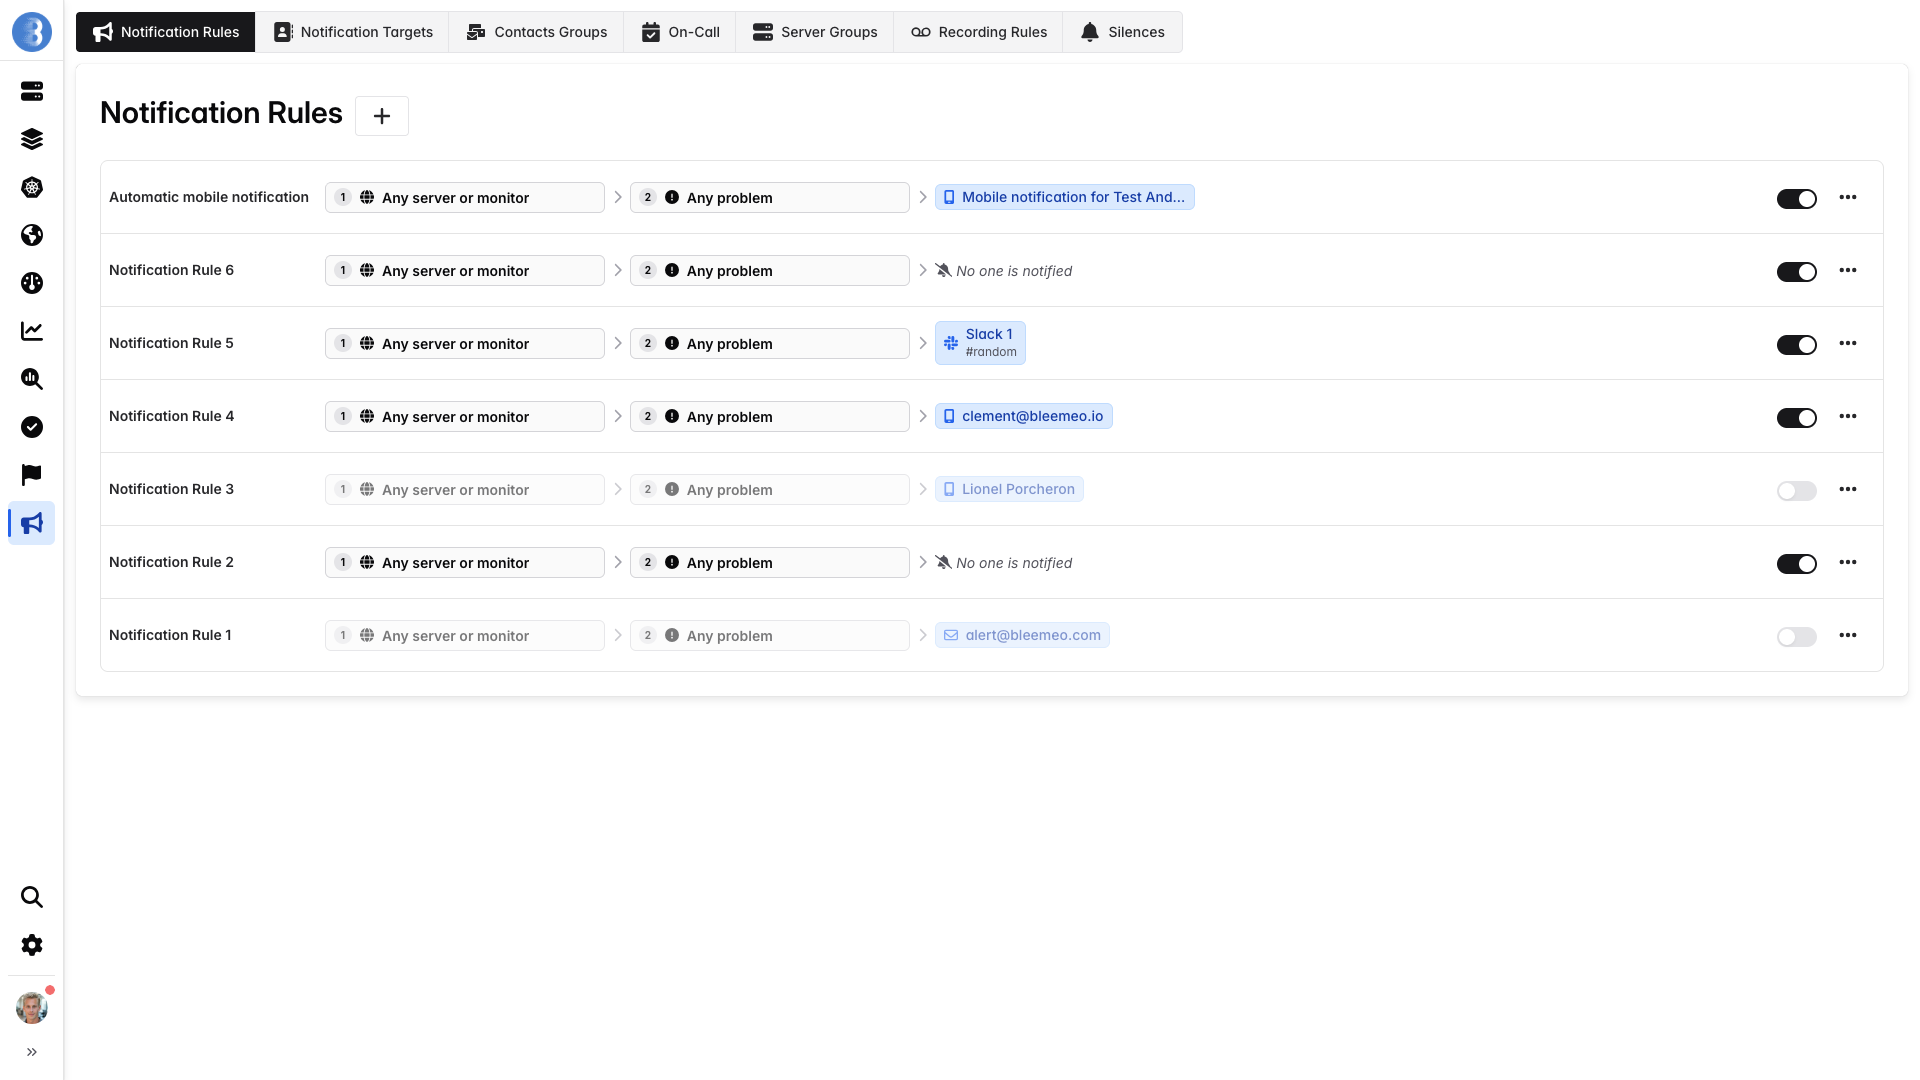
Create Notification Rule
Section titled “Create Notification Rule”You can create new notification with the + Notification button.
1st Step: Scope
Section titled “1st Step: Scope”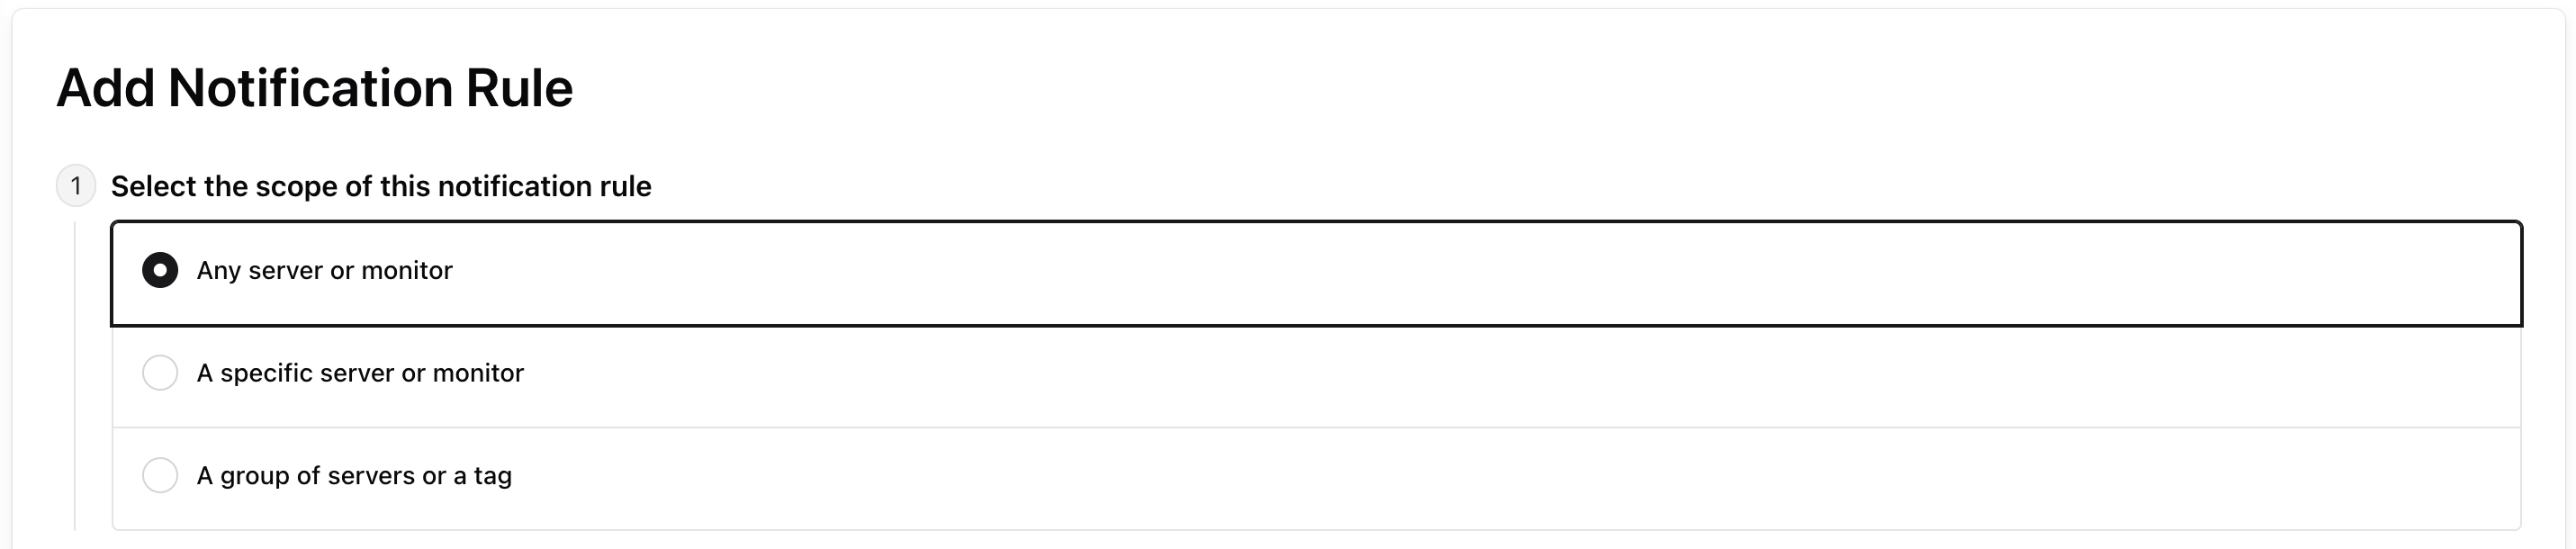
The first thing to do when creating a new notification is to select the scope of the notification rule. You can:
- Be notified on any server(s)
- Be notified on a specific server
- Be notified on a group of servers (Server group or Tag)
2nd Step: Problem
Section titled “2nd Step: Problem”Problem with metric
Section titled “Problem with metric”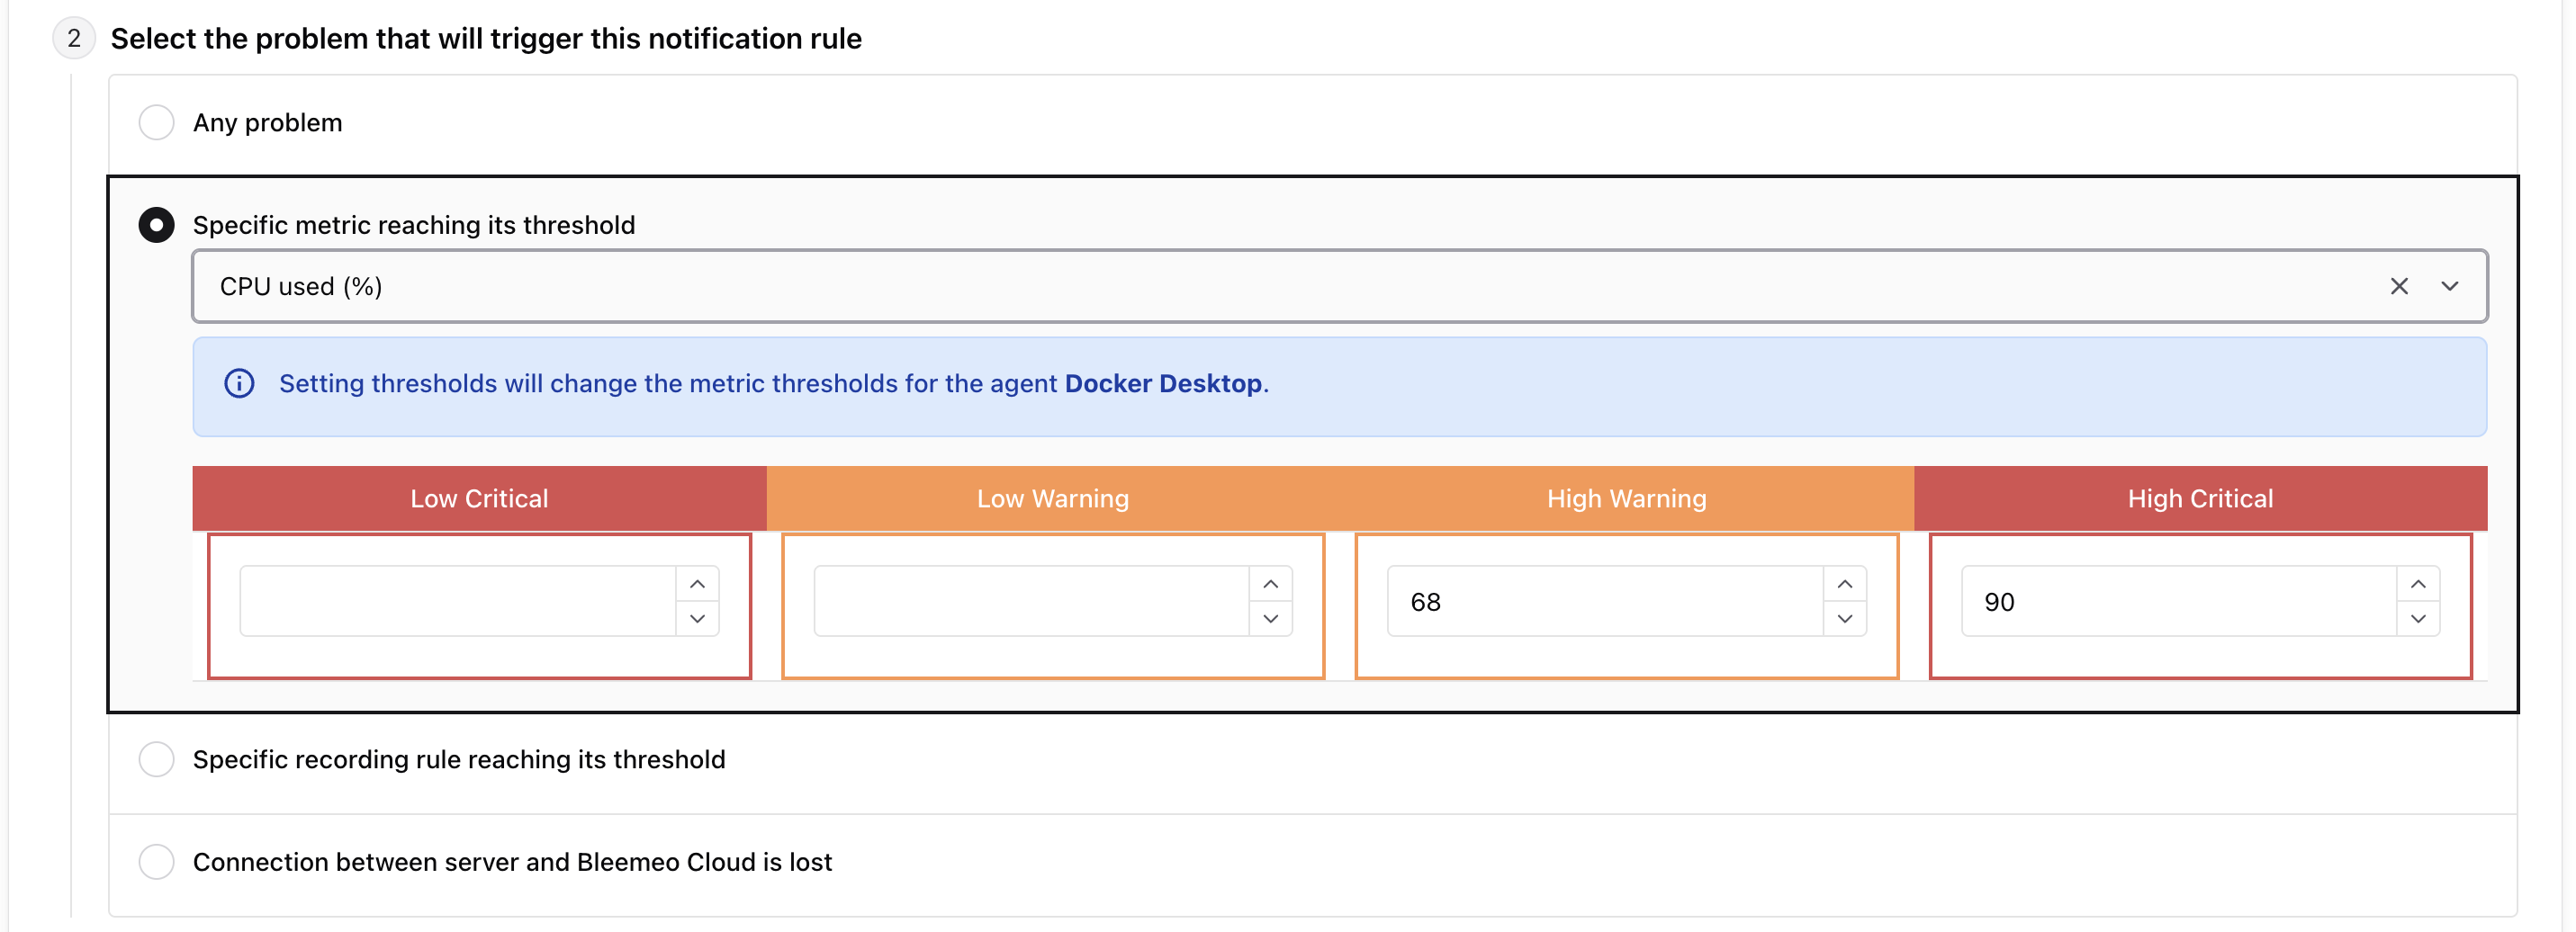
You have four possibilities of problem with metric:
- Be notified for any problem on selected server(s)
- Be notified for specified problem on selected server(s)
- Be notified with recording rule
- Be notified when selected server(s) lose connection (this option doesn’t exist if you selected a monitor in the previous view)
Problem with Recording Rule
Section titled “Problem with Recording Rule”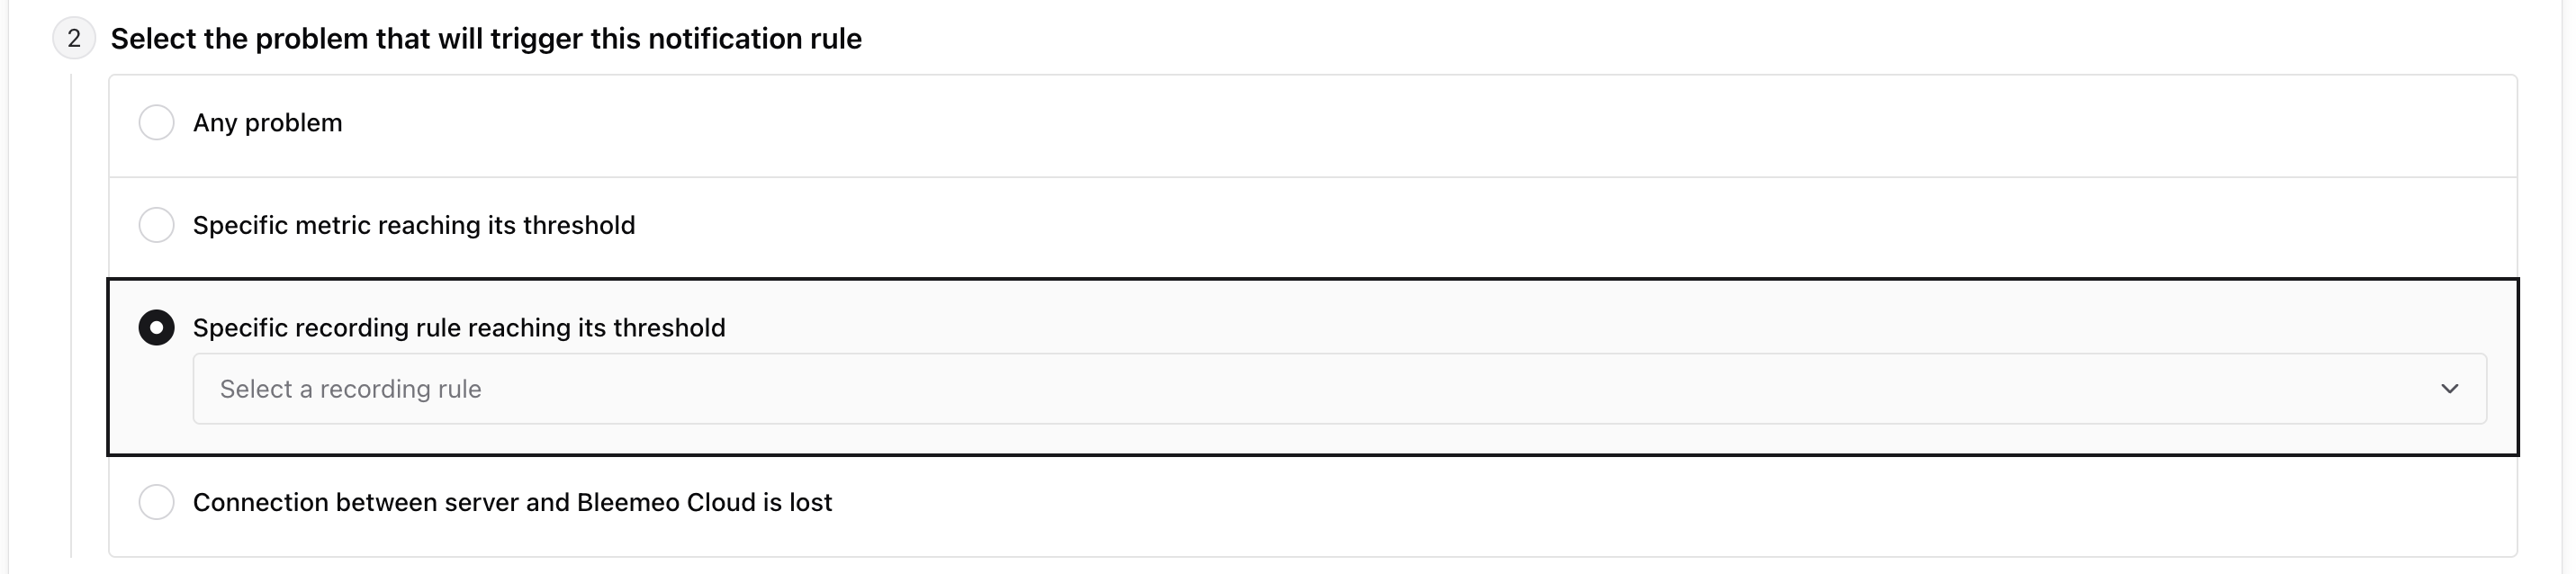
To create a recording rule with PromQL, you can use our documentation.
You need to choose a name; this name will be used as the alert name in the status dashboard and notifications.
You can add warning and/or critical PromQL and configure the delay. The delay corresponds to the time during which the threshold of the PromQL must be exceeded to change its status.
3rd Step: Targets
Section titled “3rd Step: Targets”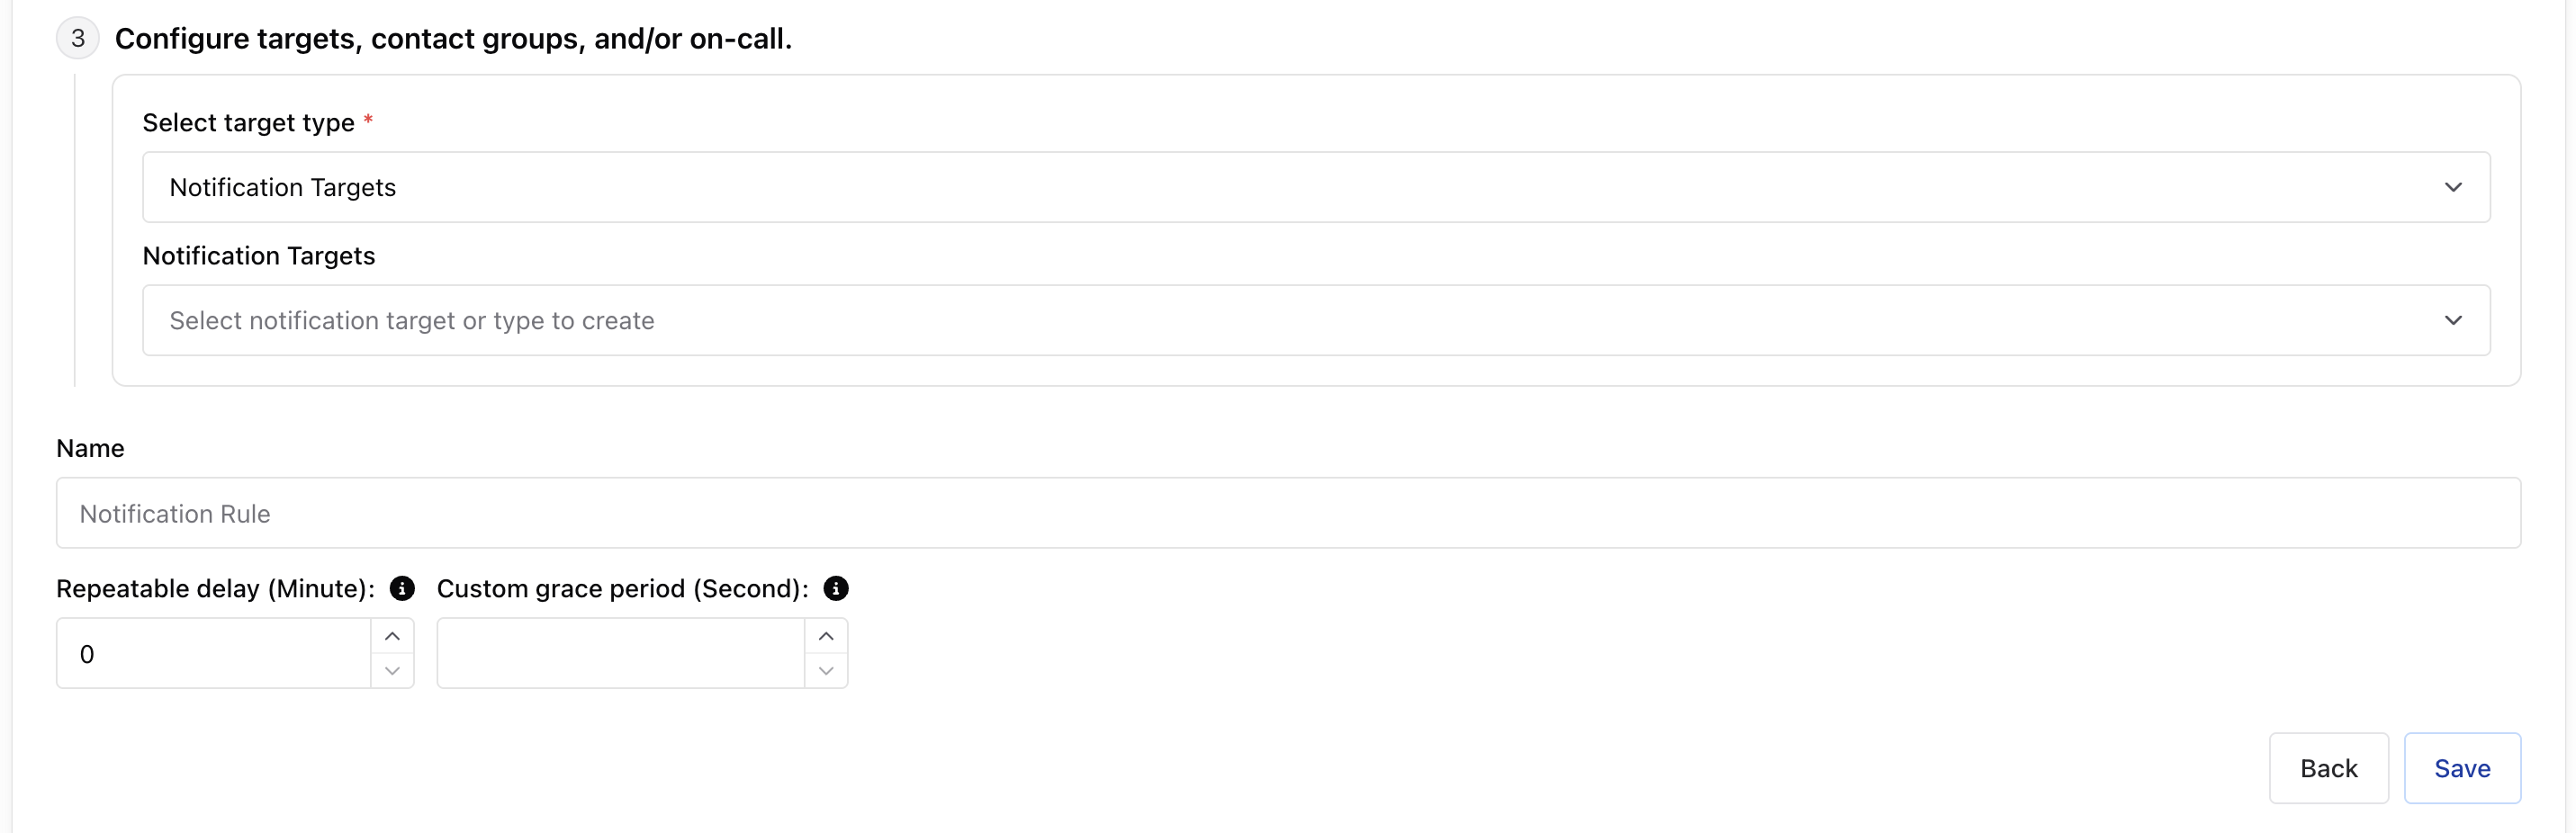
Finally, you need to select who will be notified and how. You can directly choose targets and/or a contact group. If you want to create a new integration, you can by clicking on + More.
If you have selected a contact group that doesn’t exist, in the next view, you should edit this contact group to add targets.
Set a delay for repetition
Section titled “Set a delay for repetition”You can add a repeat delay to a notification rule. This delay is in minutes and is 0 by default, which means the event will be notified only once, without repetition.
If you change it to 10 for example, you will receive a notification every 10 minutes for an event until it becomes “OK” again.
You can stop the repetition of an event from two views: the list of events and the status dashboard. If the event returns to “OK” and then goes back into error, the repetition starts again.
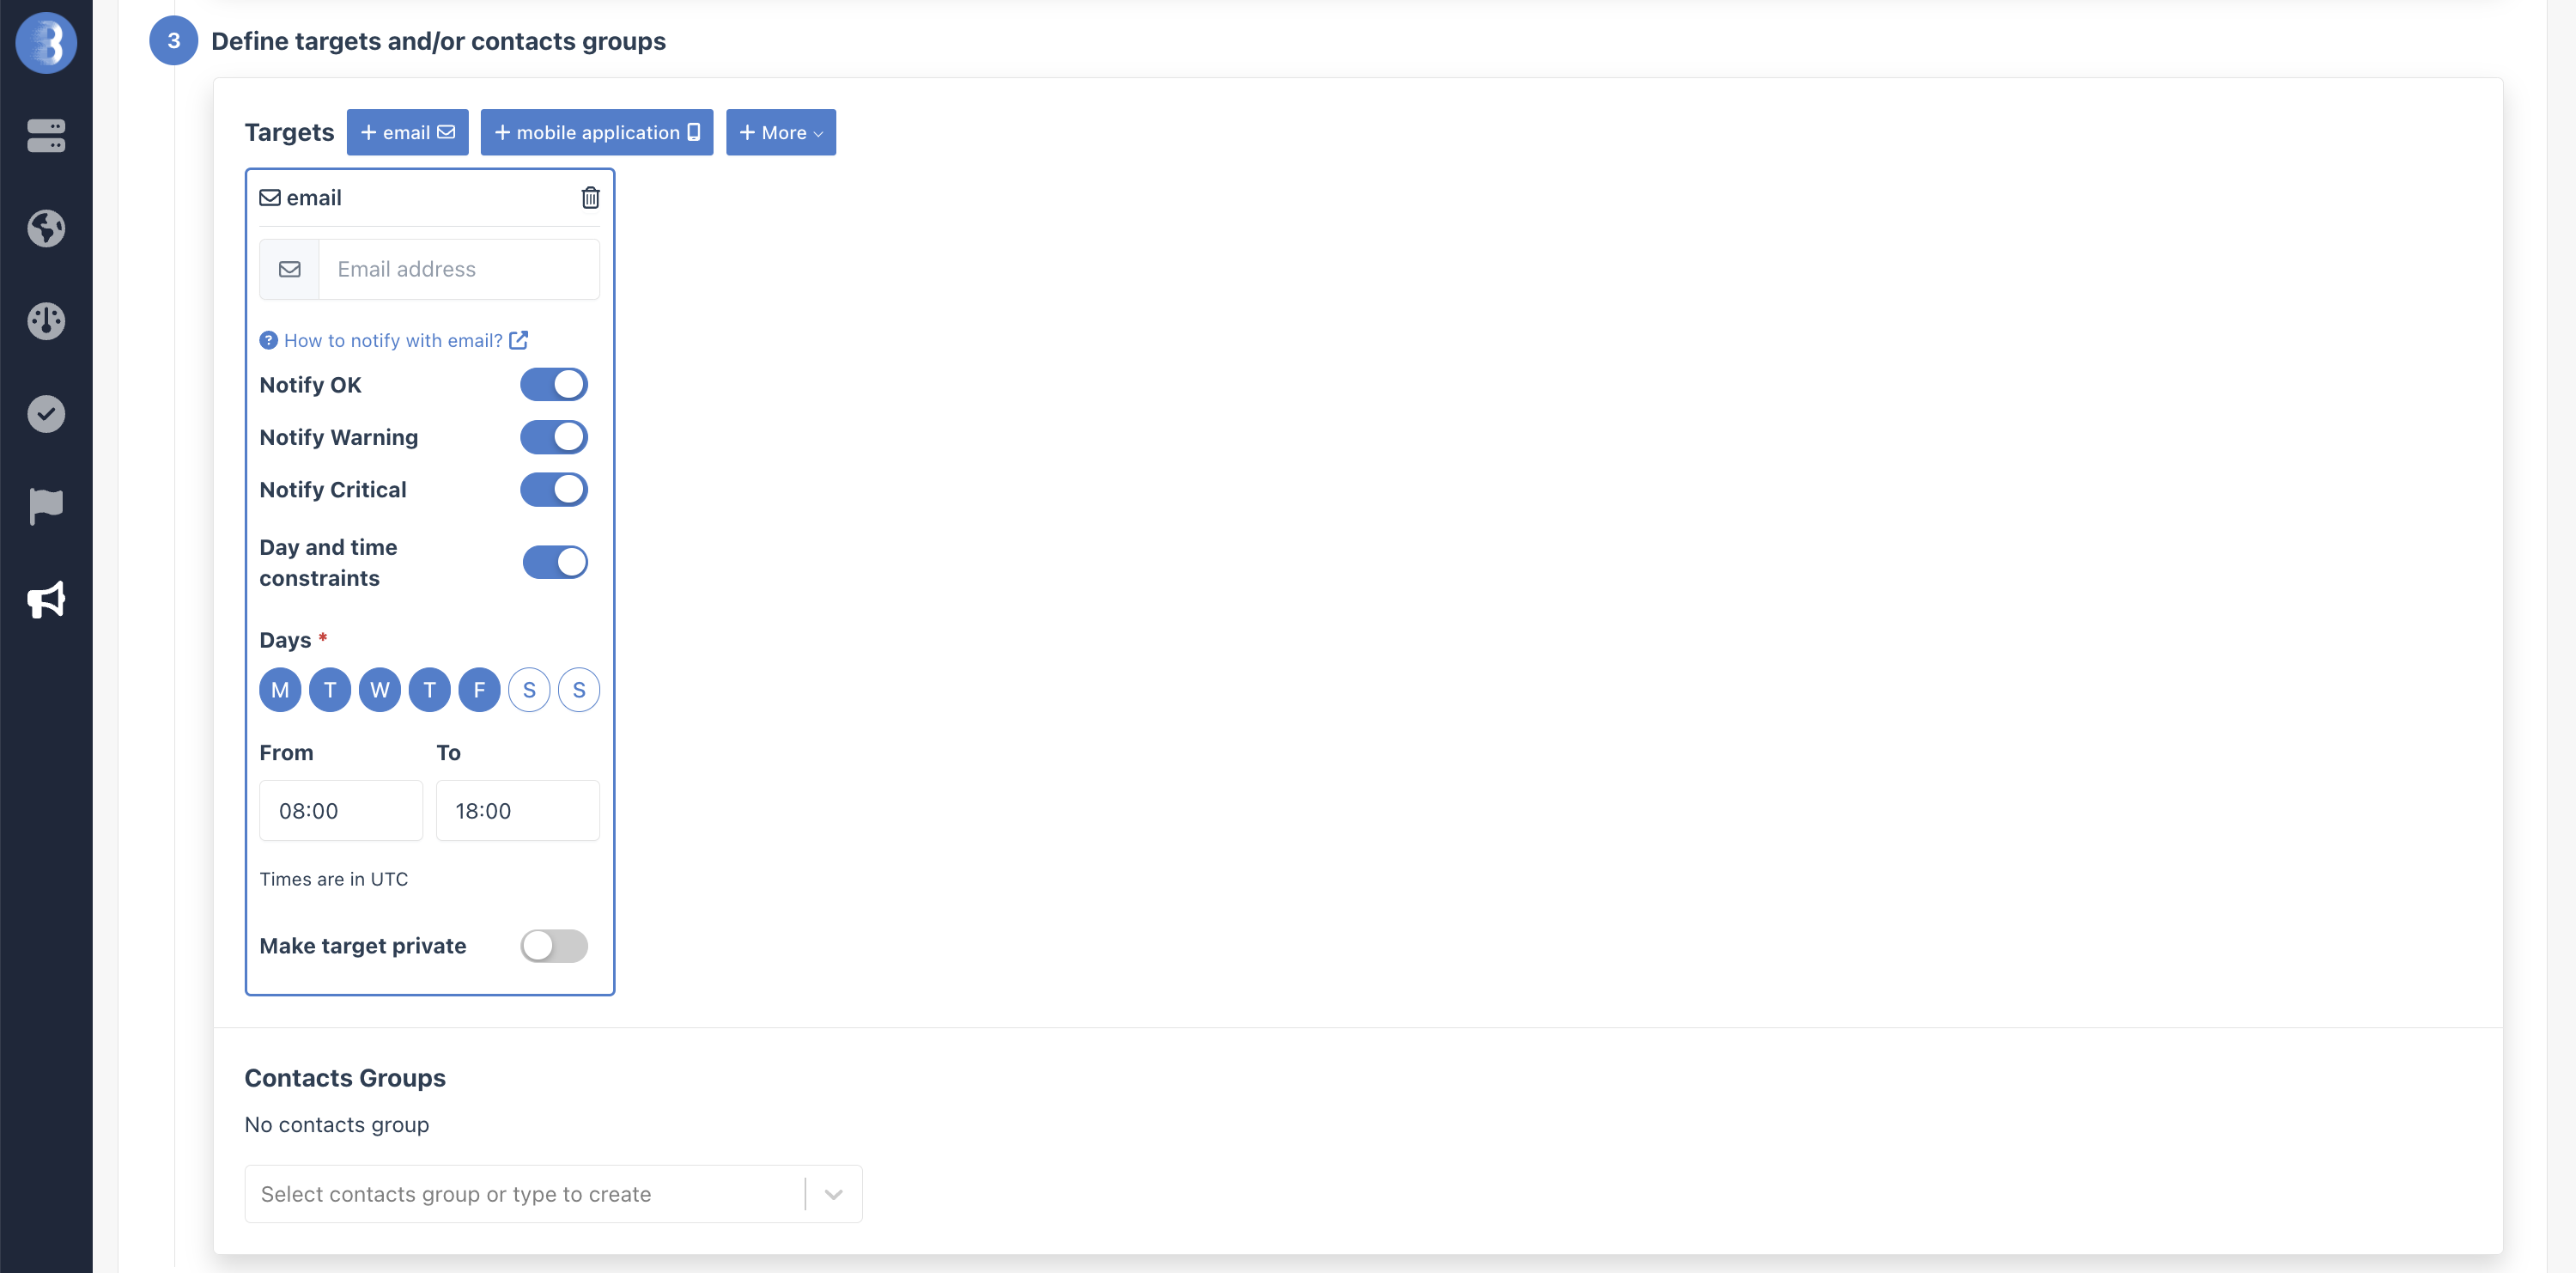
Set time constraints on Target
Section titled “Set time constraints on Target”You can choose the days and times when you want to receive notifications from each target.
For this example, notifications will be sent only Monday to Friday between 8:00 am and 6:00 pm (UTC).
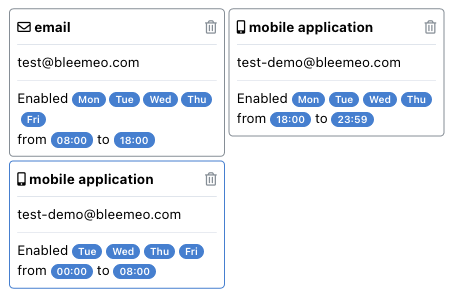
Or this example:
- Monday to Friday between 8:00 am and 6:00 pm (UTC) on email
- Weeknights on mobile application
- No notifications from Friday 6:00 pm to Monday 8:00 am
Once done click the Save button. Your new notification rule is added at the end of the list. It is enabled by default.