Docker Monitoring
Docker Metrics
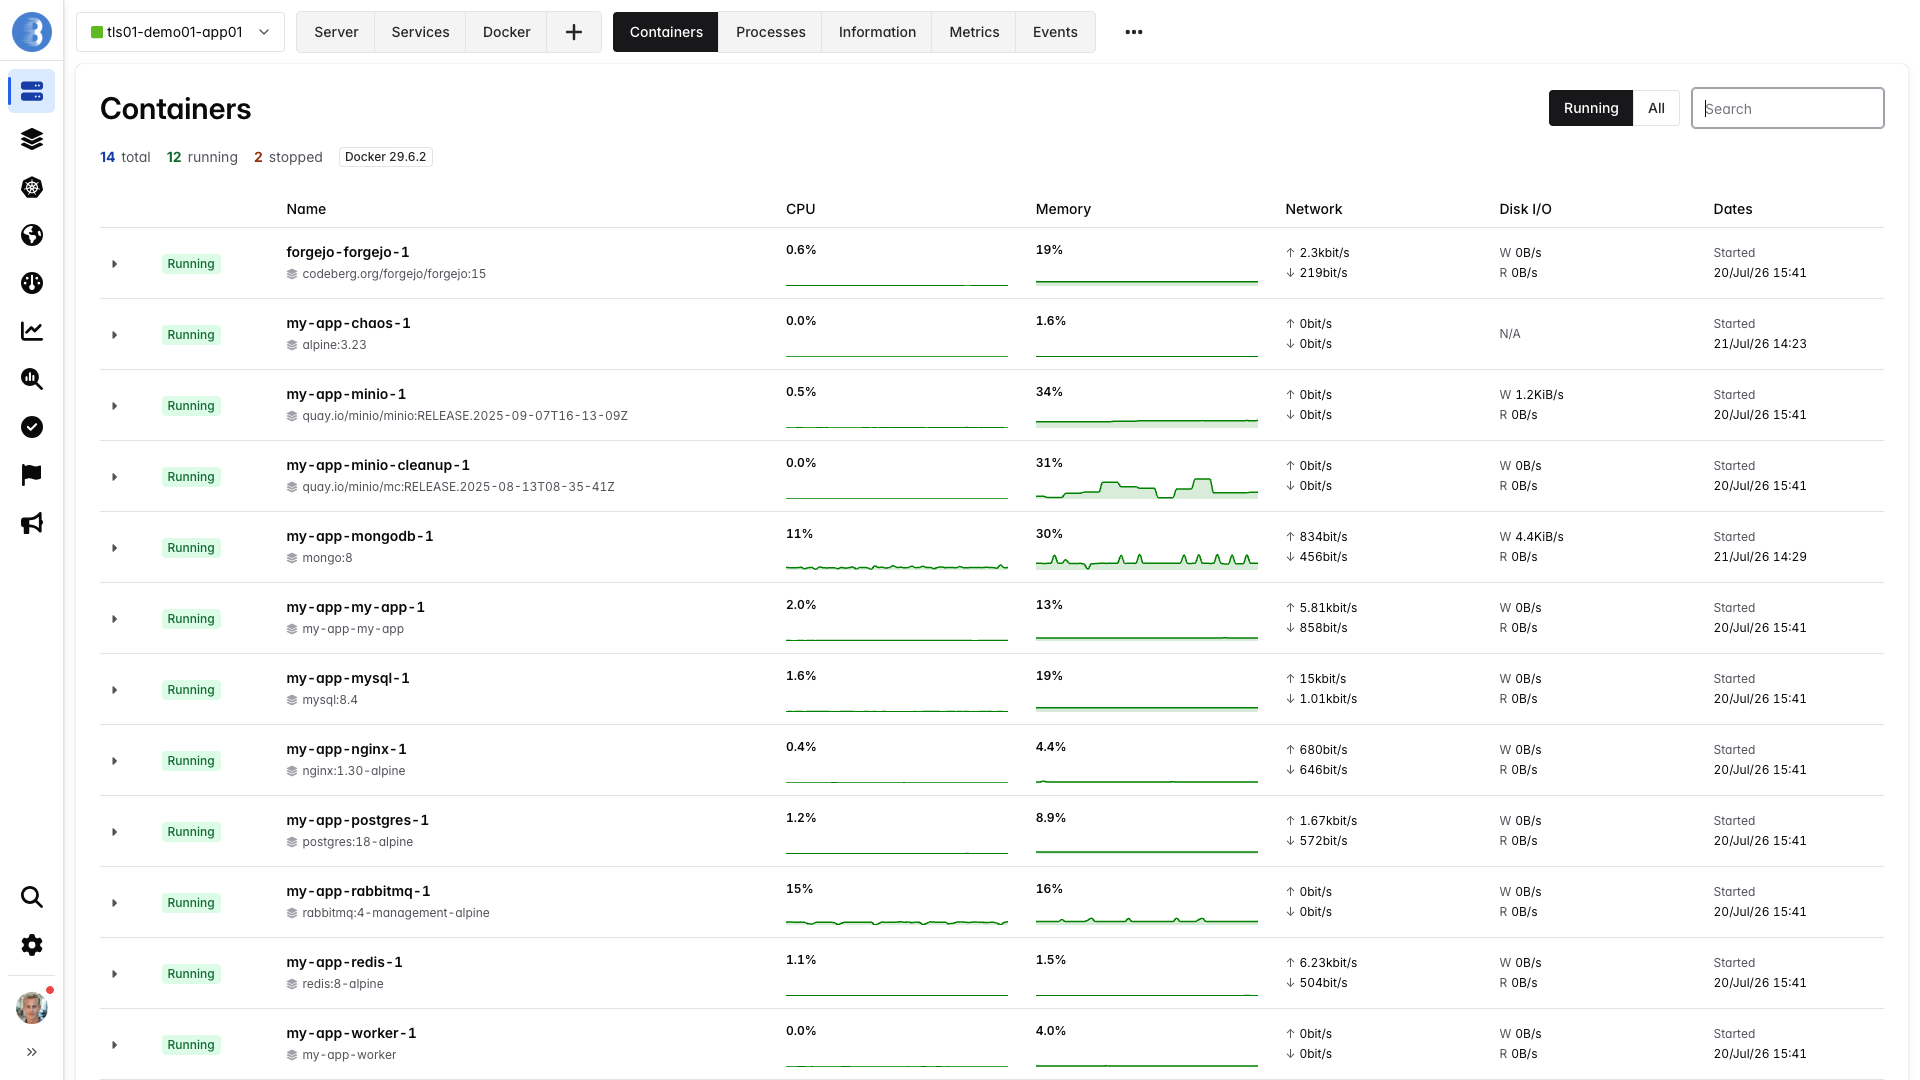
Section titled “Docker Metrics”The agent gathers the following metrics:
- containers_count: Number of running Docker containers.
In addition to the above global metric, the following information is retrieved per Docker container:
- Name of the container.
- Docker ID of the container.
- Status of the container (running, stopped, …).
- Date when the container was created, started, and/or stopped.
- Image name used to create the container.
- Command used to create the container.
- A copy of Docker inspect for the container.
The above information is not archived: only the latest value is available, and when a container is destroyed, the information for this container is deleted.
Finally, for each container, the agent gathers the following metrics:
| Metric | Description |
|---|---|
container_cpu_used | CPU used by container in percent |
container_cpu_throttled_perc | Percentage of CFS scheduler periods during which the container was throttled because it reached its CPU limit |
container_health_status | Status of Docker container, if your container has an HEALTHCHECK defined, this metric will contain the result of this check |
container_io_read_bytes | Disk read throughput of container in bytes per second |
container_io_write_bytes | Disk write throughput of container in bytes per second |
container_mem_used | Memory used by container in bytes |
container_mem_used_perc | Memory used by container in percent |
container_mem_used_perc_status | Status of memory used by container |
container_net_bits_recv | Network traffic received by container in bits per second |
container_net_bits_sent | Network traffic sent by container in bits per second |
Docker Labels
Section titled “Docker Labels”The following labels are known by the Bleemeo agent:
glouton.enable: If false, the Bleemeo agent will ignore the container. Once ignored, information and metrics from this container won’t be gathered and any service running in this container won’t be discovered.glouton.check.ignore.port.80: If true, the Bleemeo agent skips the check on port 80 that auto-discovery may have wrongly detected. This option isn’t limited to port 80, and any other value could be used.prometheus.io/scrape,prometheus.io/path,prometheus.io/port: Configure the Bleemeo agent to scrape a Prometheus metric exporter. See the Prometheus page for details.glouton.allow_metrics,glouton.deny_metrics,glouton.include_default_metrics: Configure which Prometheus metrics are scraped. See the Prometheus page for details.
You can also override a service’s configuration from a container by setting a glouton.<setting> label
(for example glouton.username or glouton.password). For security reasons, only an allow-list of
settings can be set this way — sensitive settings are restricted by default so that anyone able to start
a container cannot alter Glouton’s behavior. See the
service settings table for the available settings and
which ones are allowed by default.
Filtering monitored containers
Section titled “Filtering monitored containers”You can configure which containers will be monitored by the Bleemeo agent. In addition to
the label glouton.enable described above, the following can be added to the
Bleemeo agent configuration:
container: filter: allow_by_default: true allow_list: - "bleemeo_*" deny_list: - "bleemeo_ephemeral" - "bleemeo_builder"This will:
allow_by_defaultenables monitoring of a container when the container name is neither allowed nor denied by the lists, or when the container doesn’t have the labelglouton.enable. If unspecified,allow_by_defaultis enabled.deny_listis a list of container names that will not be monitored. They are not monitored even if also present inallow_listor with a labelglouton.enable. The deny_list takes precedence over other configuration.allow_listis a list of container names that will be monitored, unless excluded by thedeny_list. The allow_list takes precedence over aglouton.enablelabel.
For both the allow_list and the deny_list, you can use a plain name or a pattern with the * wildcard. In the above example,
bleemeo_* matches anything that starts with bleemeo_.