

Bleemeo Mobile Application
Stay connected to your infrastructure wherever you are. The Bleemeo mobile app gives you instant access to all your monitoring data, real-time alerts, and dashboards right from your pocket.


Key Features
Section titled “Key Features”Home Dashboard
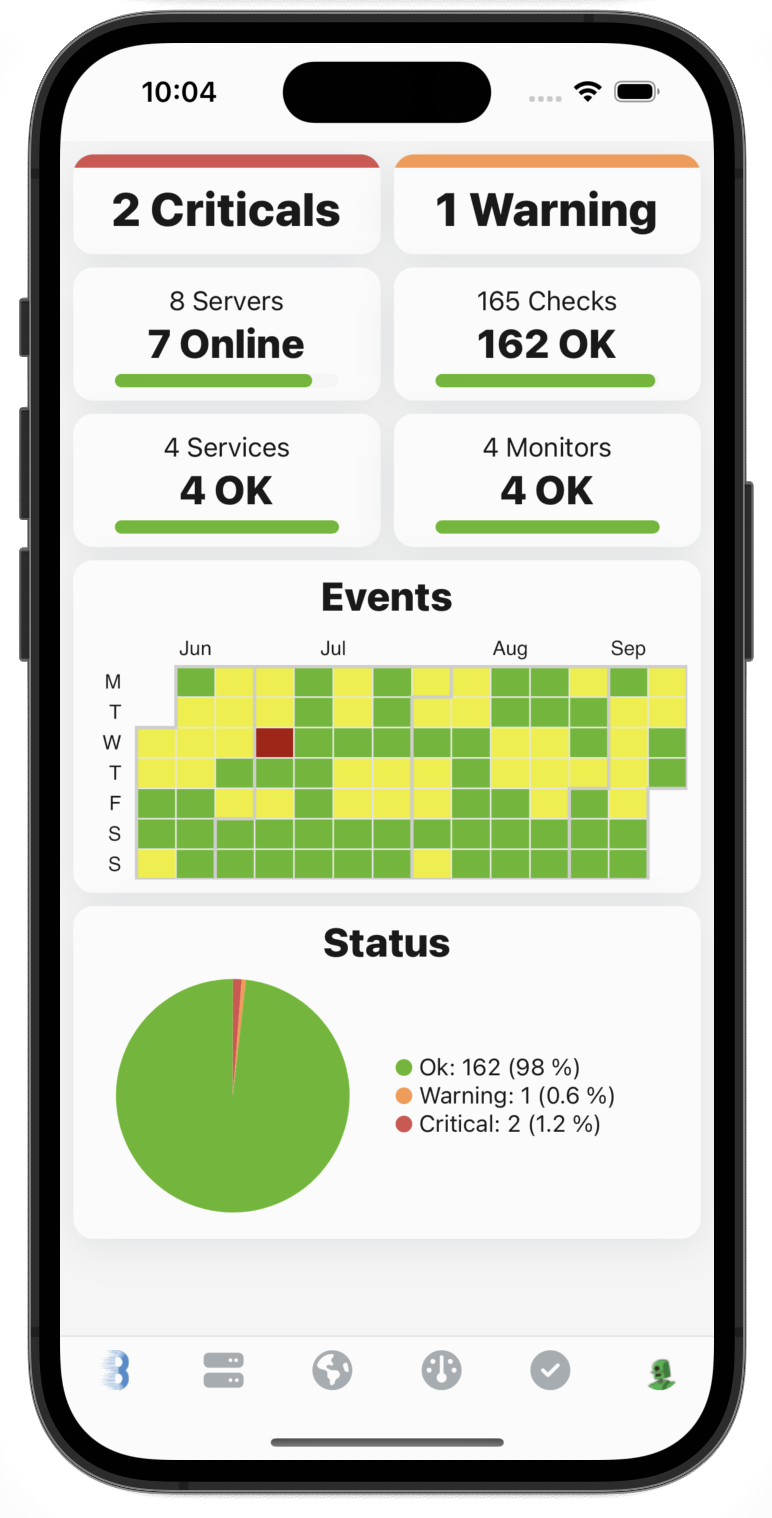
Section titled “Home Dashboard”The home screen provides an immediate overview of your infrastructure health. At a glance, you can see:
- Infrastructure heatmap showing event activity over time
- Server status with the count of healthy, warning, and critical servers
- Service status summary across all monitored services
- Quick navigation to dive into any section
Server Monitoring
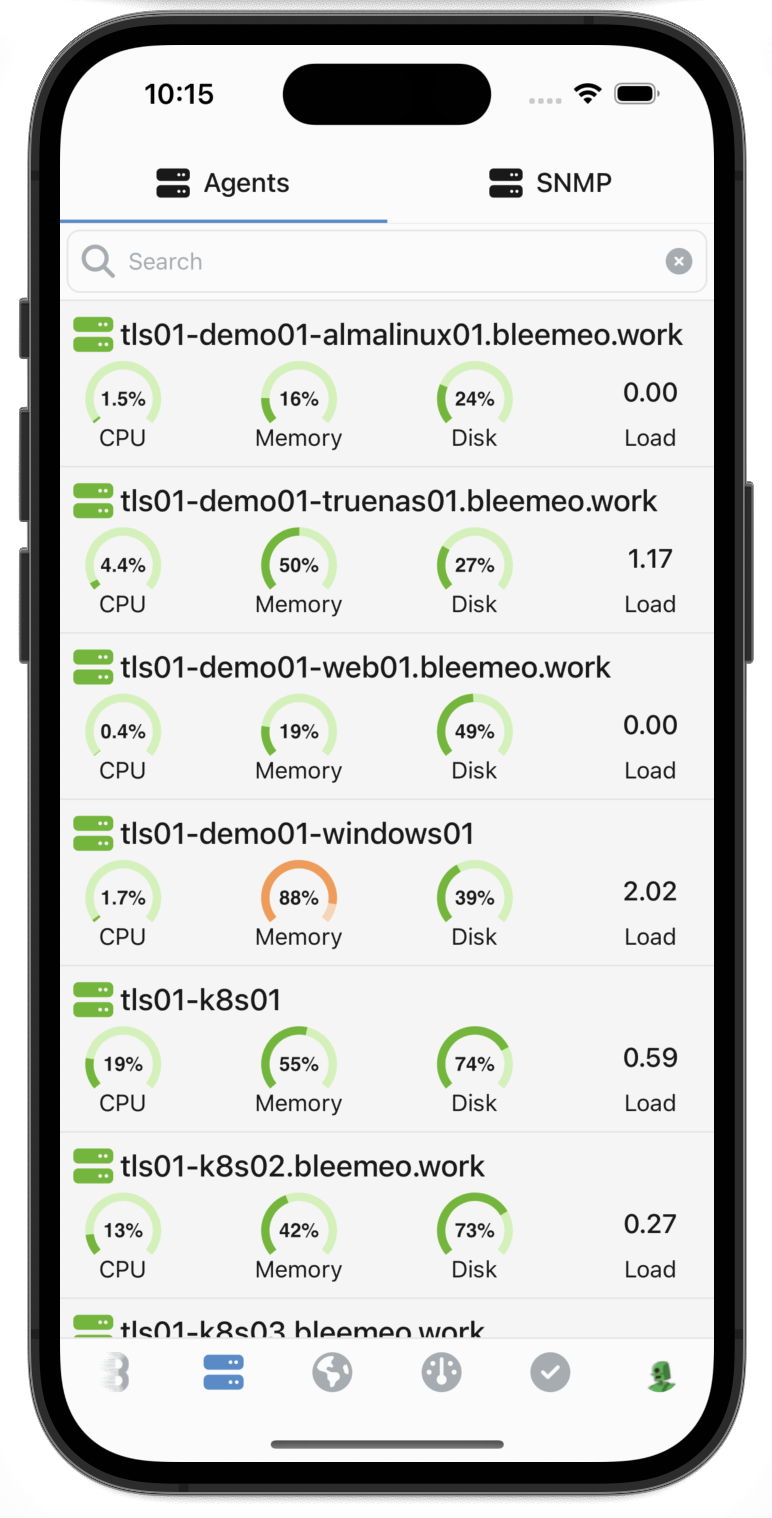
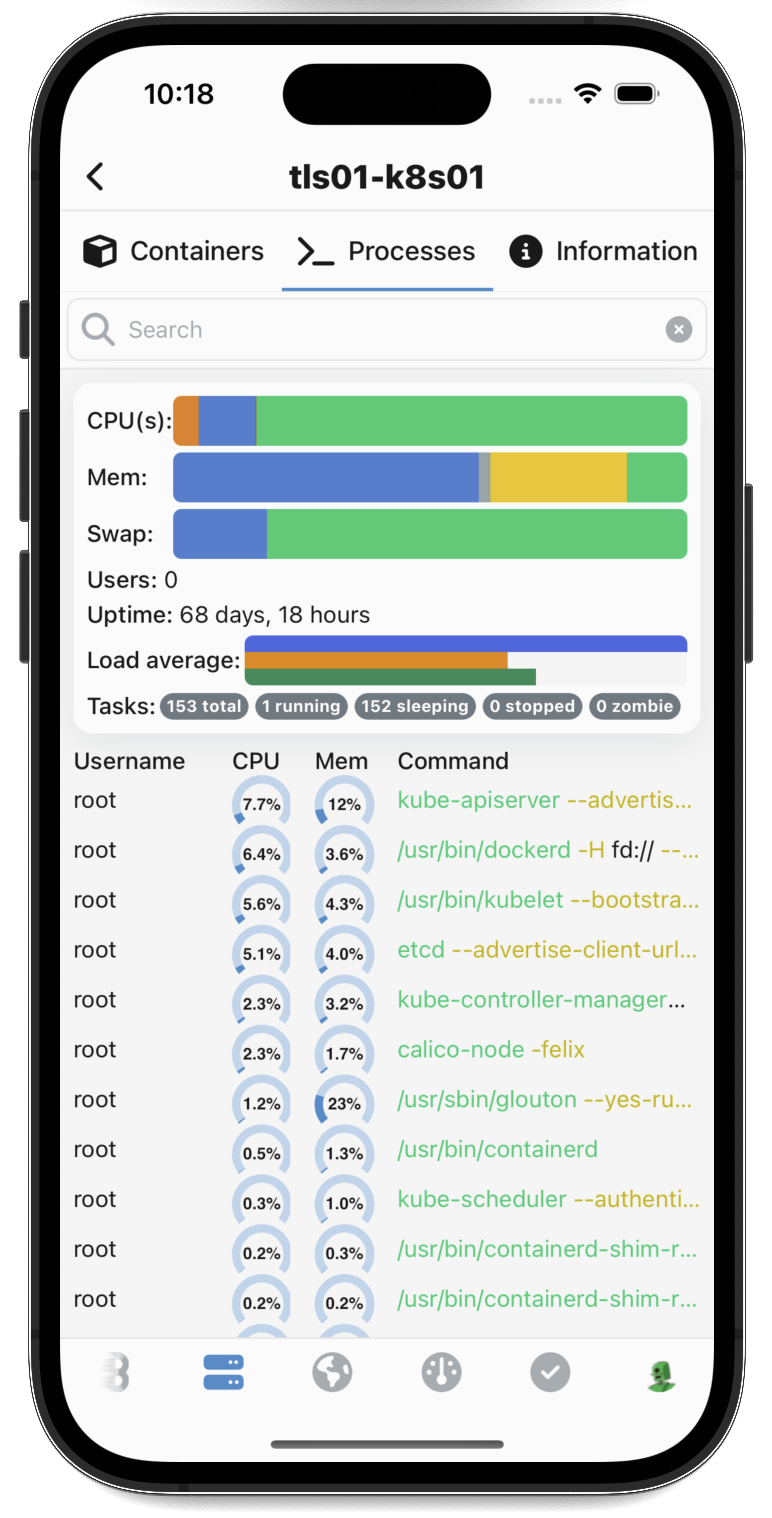
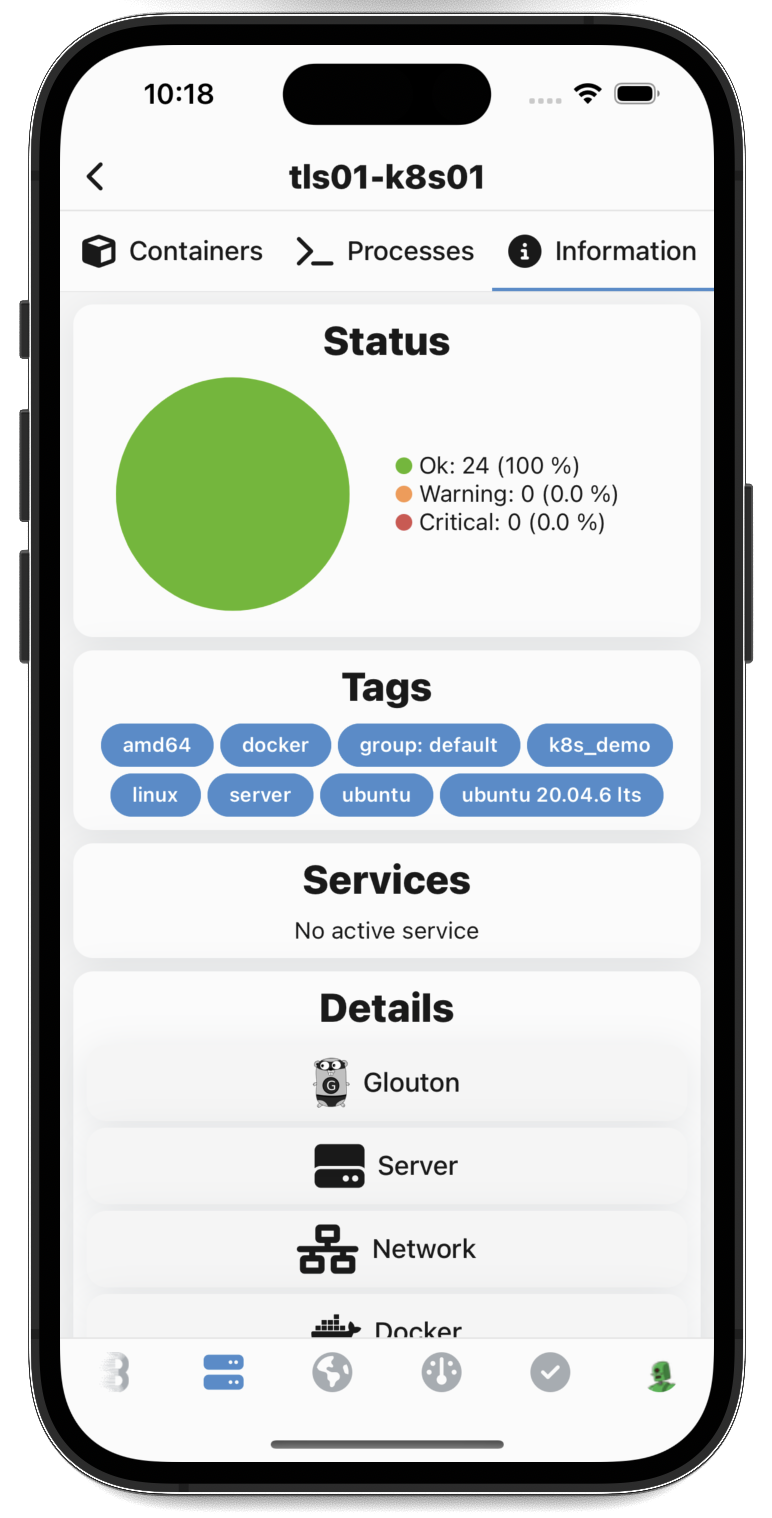
Section titled “Server Monitoring”Access detailed information about each server in your infrastructure. The server view lets you:
- Browse all your servers with instant status indicators
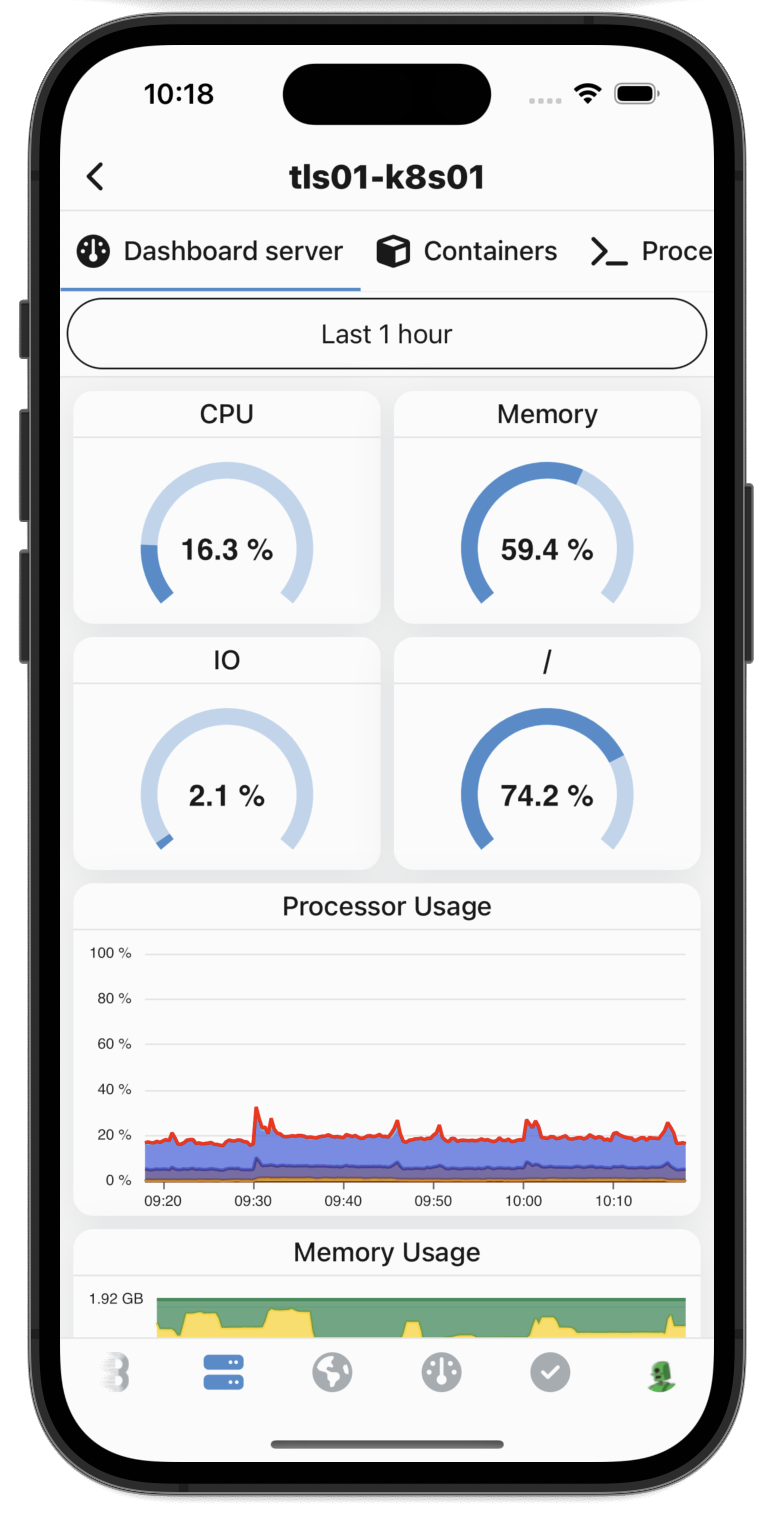
- View the default dashboard with key system metrics
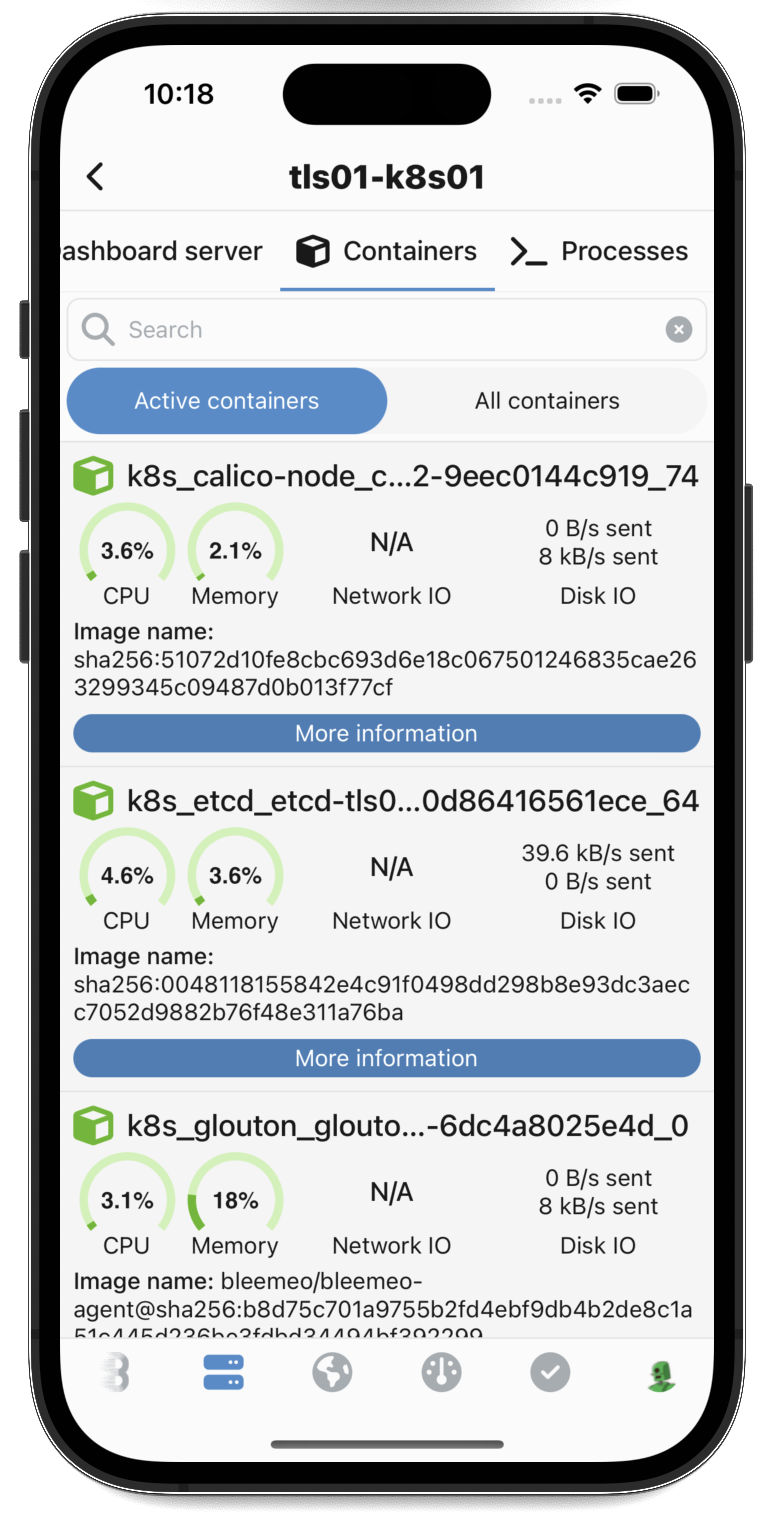
- Monitor Docker containers running on each server
- See live process information in real time
Detailed Server Metrics
Section titled “Detailed Server Metrics”Swipe between different views to get comprehensive server information:
Custom Dashboards
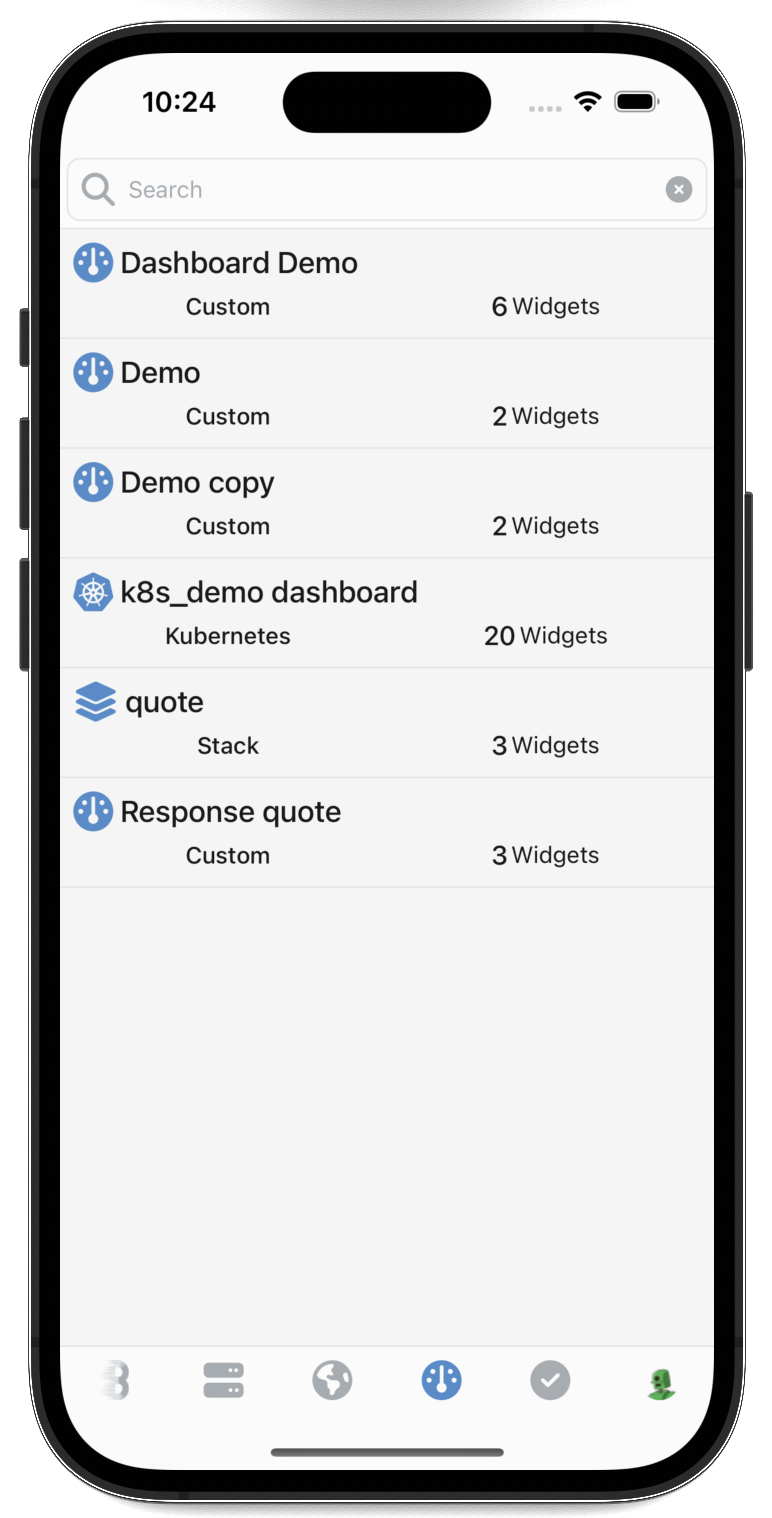
Section titled “Custom Dashboards”All dashboards created in the Bleemeo web panel are automatically available in the mobile app. This includes:
- Custom dashboards you’ve built to track specific metrics
- Auto-generated dashboards from container labels and annotations
- Tag-based dashboards grouped by your infrastructure tags
Status Center
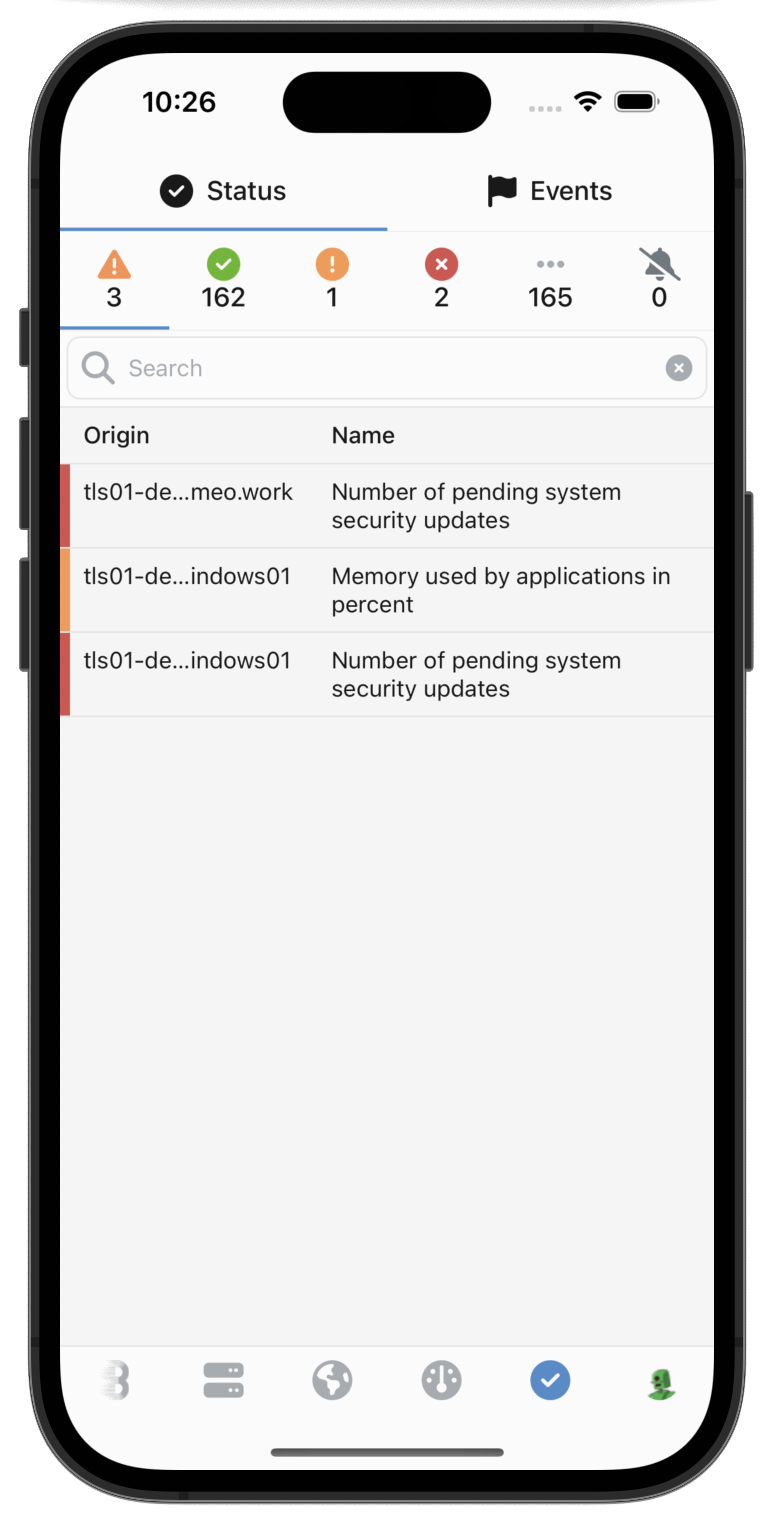
Section titled “Status Center”The status view is your go-to place when you need to quickly assess what needs attention. It consolidates all issues across:
- Servers and system resources
- Services and applications
- Docker containers
- Uptime monitors
- Custom checks
When everything shows green, you know your infrastructure is healthy. When issues arise, you can immediately identify and investigate them.
Home Screen Widgets
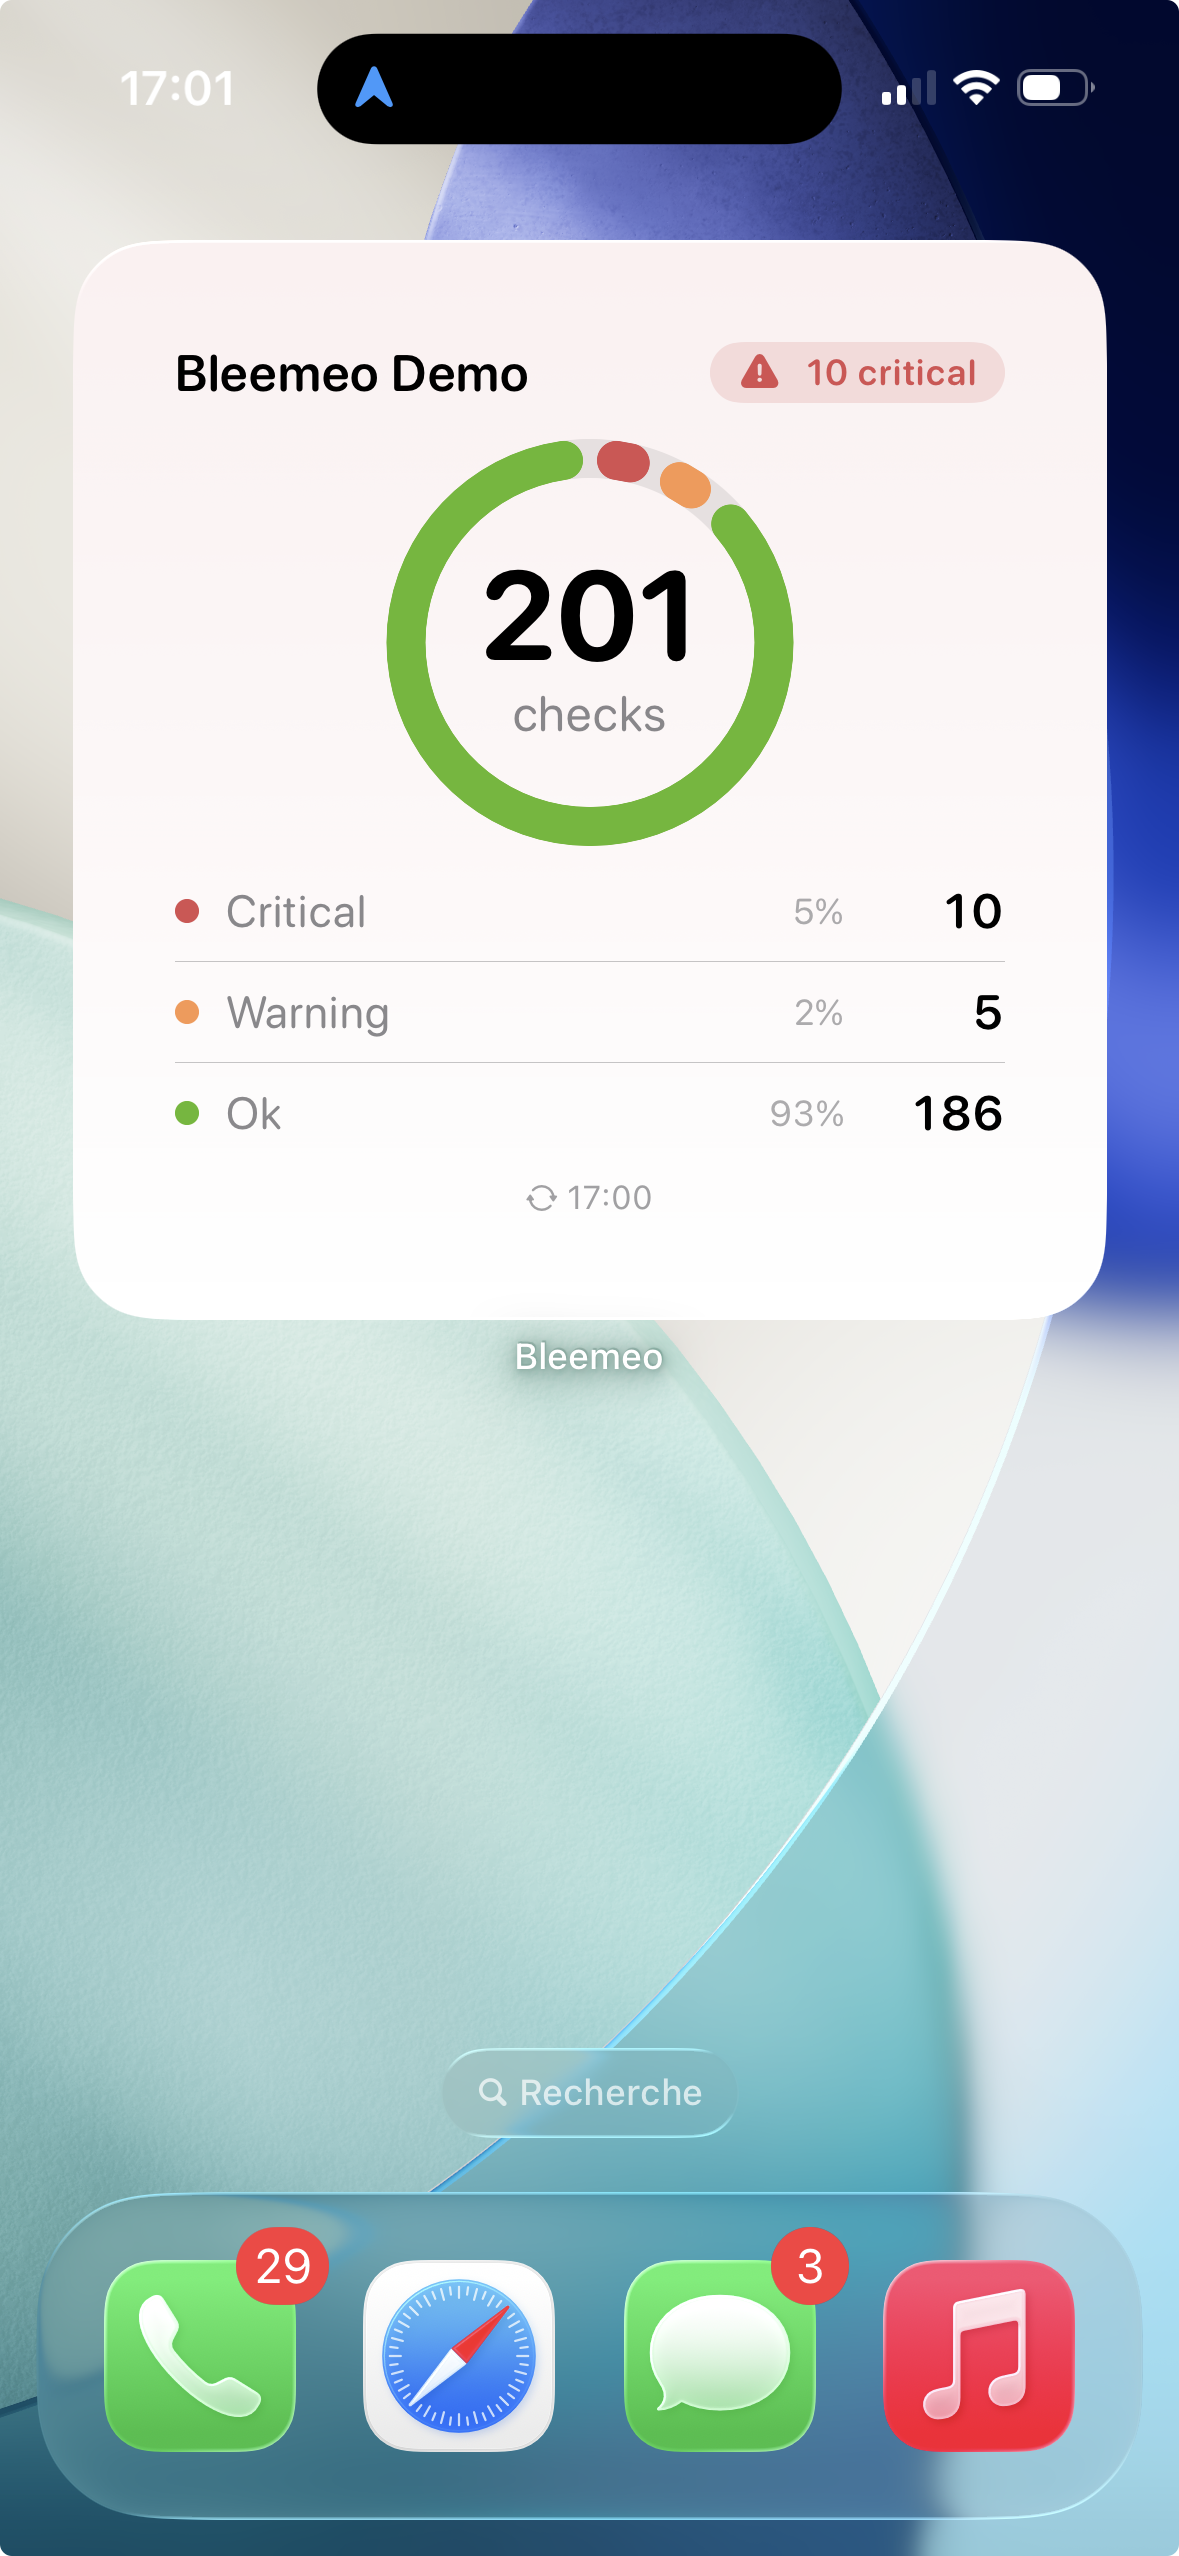
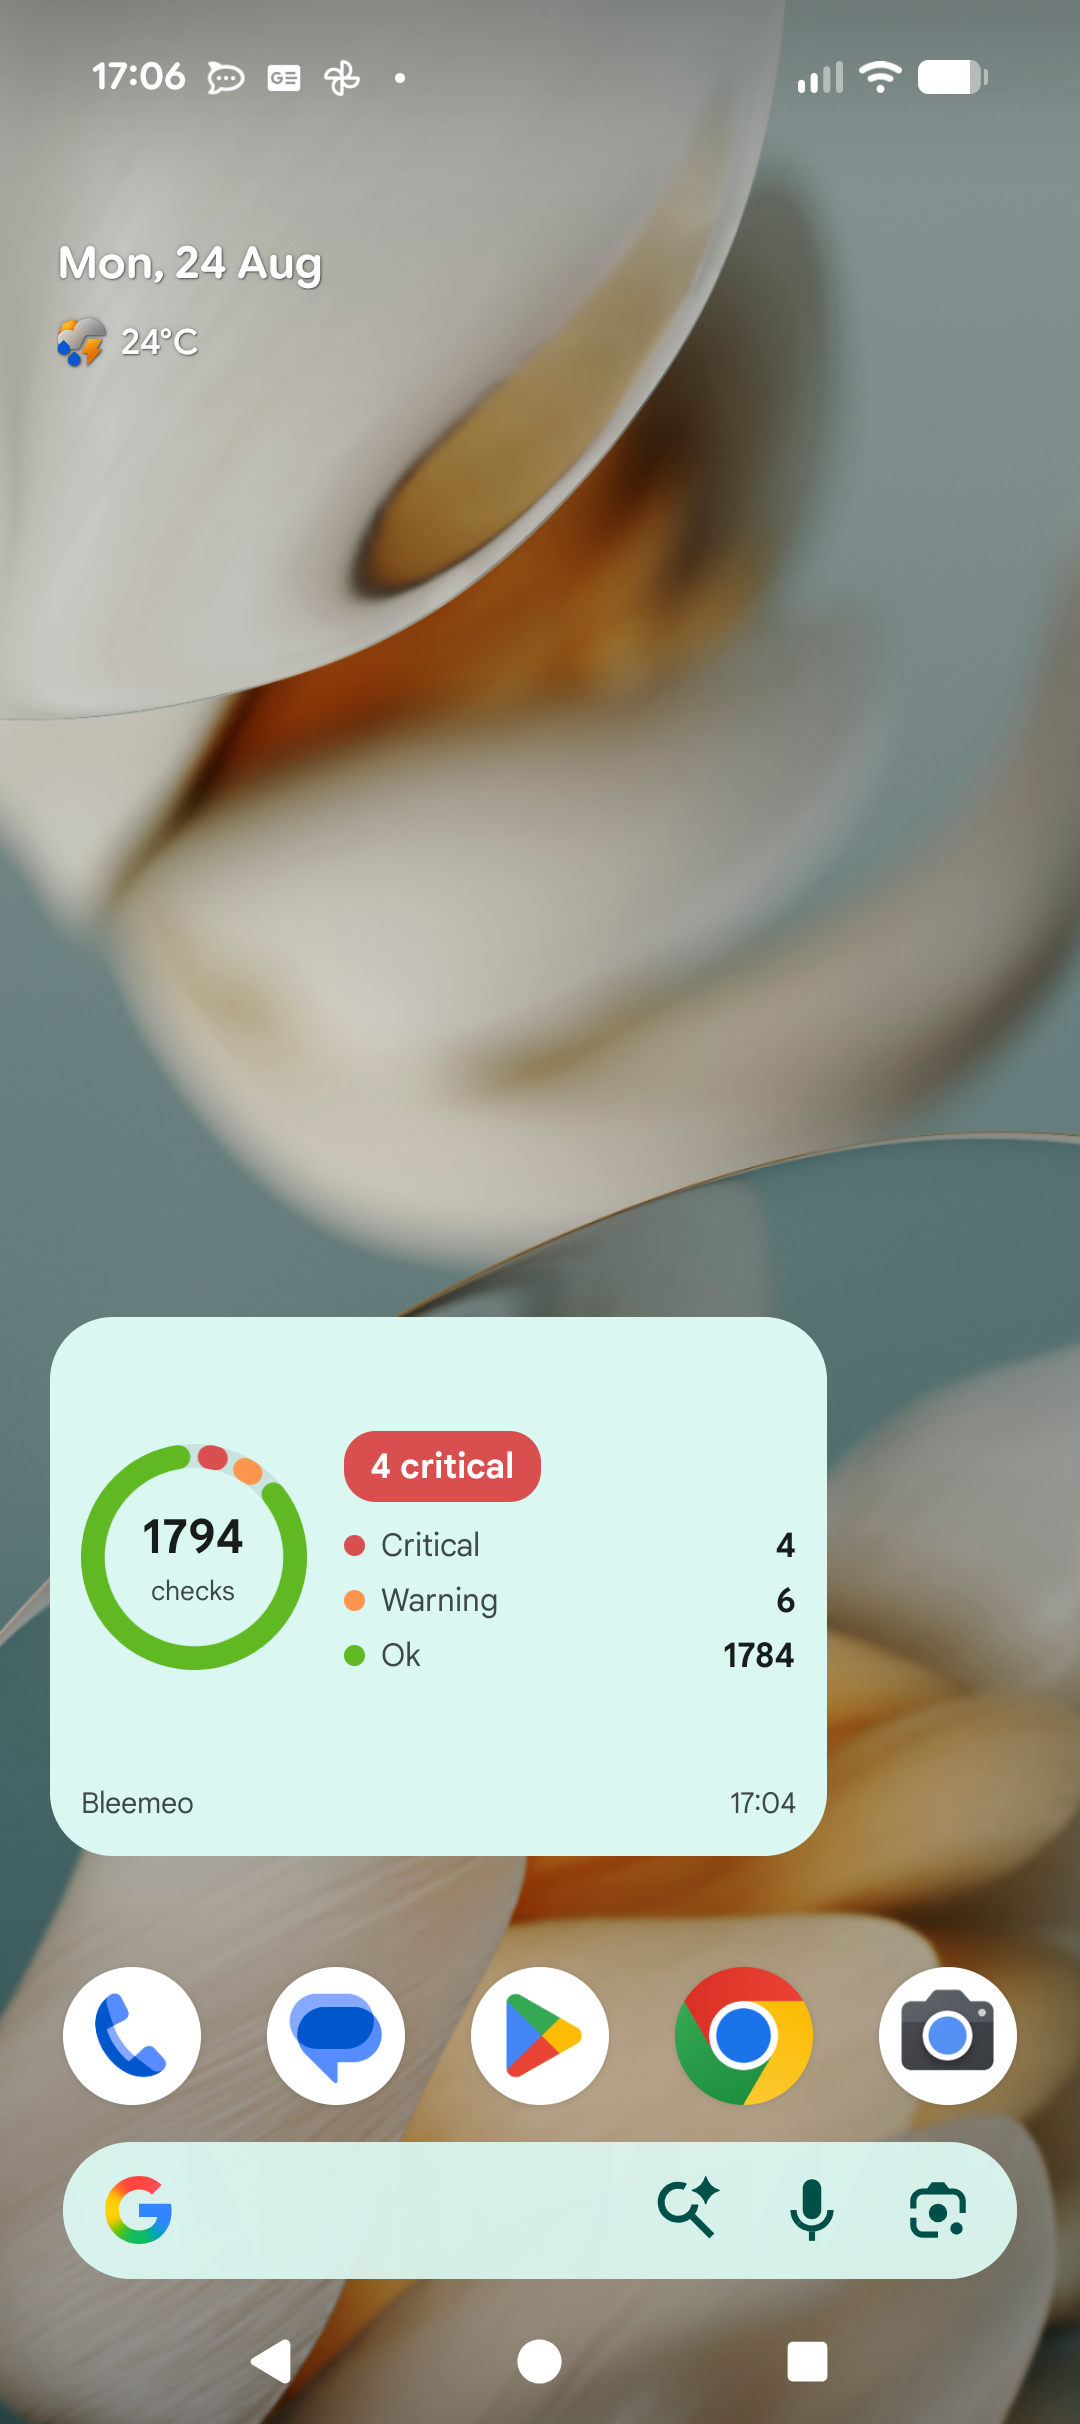
Section titled “Home Screen Widgets”Since version 15.0, the app ships two home screen widgets. They are the fastest way to check your infrastructure: no unlock, no app launch, just a glance at your phone.
Account health
Section titled “Account health”An overview of all the checks of one account:
- The check donut, split by status: OK, warning, critical and unknown
- The worst current status, as a colored pill
- The total number of checks being monitored
- The time of the last refresh
On iOS it comes in the small, medium and large sizes, and also as a lock screen widget. On Android it starts at 2x2 cells and can be resized.
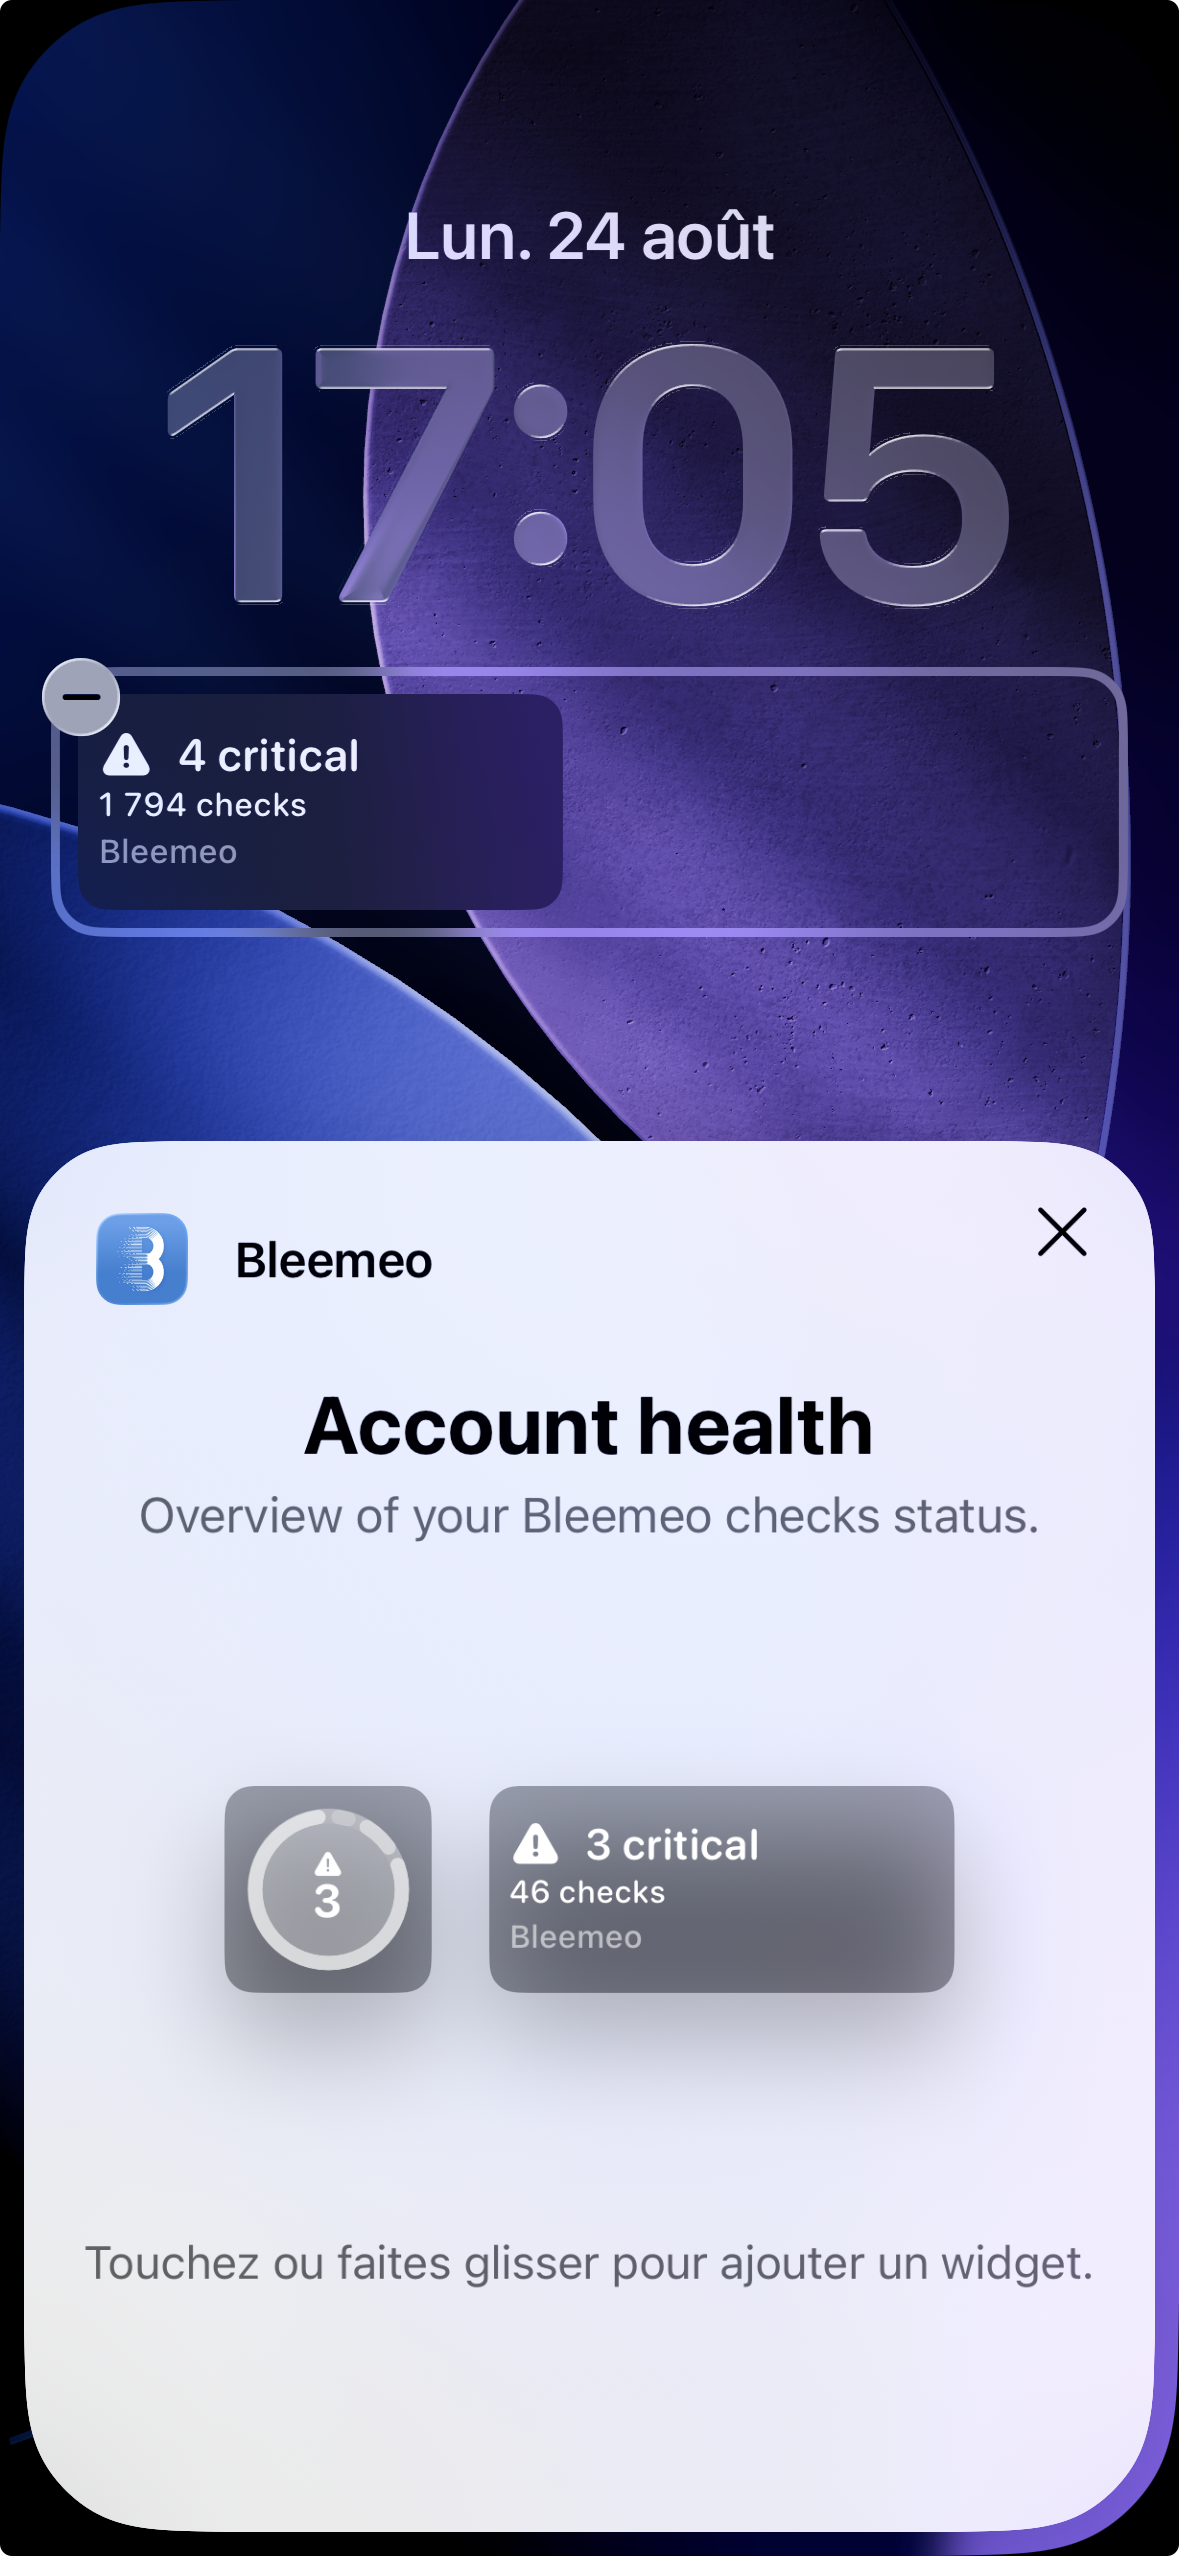
On the iOS lock screen, the widget keeps only what can be read in a glance. The circular accessory shows the count that matters most — critical first, then warning, or a checkmark when everything is green. The rectangular one adds the worst current status, the number of checks and the account name, and the inline one sits above the clock as a single line of text.
The key indicators of a single server:
- CPU, memory and disk usage, each colored by its status
- The load average
- Whether the agent is connected, and how many warning and critical checks it currently has
On iOS it comes in the small, medium and large sizes. On Android it starts at 3x2 cells and can be resized.
Adding a widget
Section titled “Adding a widget”On iOS:
- Long-press an empty area of the home screen, then tap +.
- Search for Bleemeo and pick Account health or Agent.
- Choose a size and tap Add Widget.
- Long-press the widget and choose Edit Widget to select which account or which server it should track.
For the lock screen, long-press the lock screen, tap Customize, select Lock Screen, then add a Bleemeo widget to the accessory area. The picker offers both the circular and the rectangular shape.
On Android:
- Long-press an empty area of the home screen and tap Widgets.
- Find Bleemeo and drag the widget you want onto the home screen.
- A configuration screen opens: pick the account for the Account health widget, or the server for the Agent widget.
- Long-press the widget and drag its handles to resize it.
The Account health widget can either follow the account currently open in the app, or be pinned to a specific account. That is handy when you keep an eye on an account other than the one you work in every day. Each widget keeps its own selection, so several widgets can watch several accounts or servers side by side.
Refresh and offline behavior
Section titled “Refresh and offline behavior”- Widgets refresh every 15 minutes. This is the floor imposed by both platforms for background widget updates.
- They also refresh immediately when an alert push arrives, so a widget never contradicts the notification you just received.
- They refresh as well while you use the app, whenever fresh data reaches the screen.
- With no network, the last known values stay on screen and are flagged as outdated once they are more than 45 minutes old.
- On iOS, tapping a widget opens the app.
- After a sign-out, widgets display Open Bleemeo to sign in.
Uptime Monitors
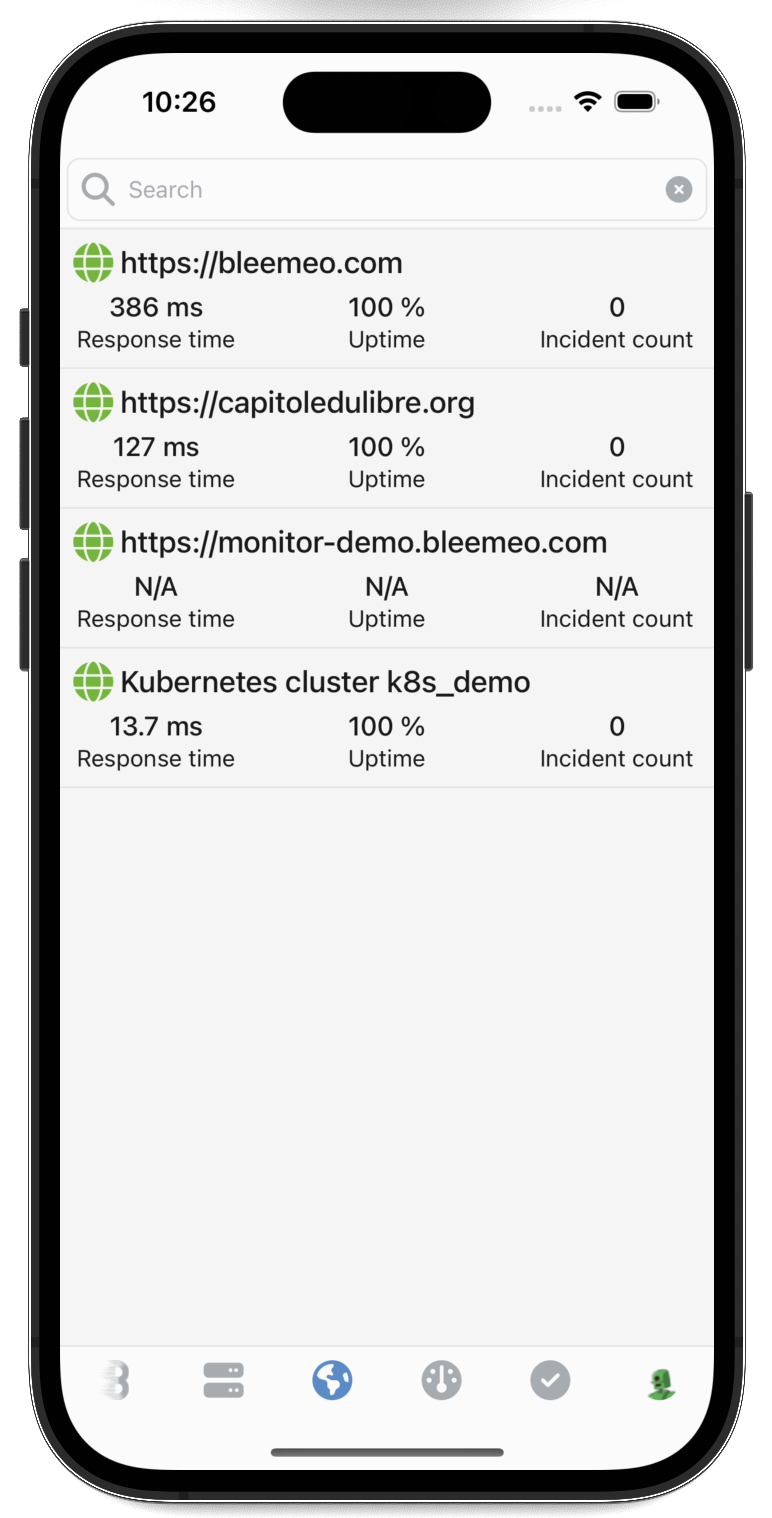
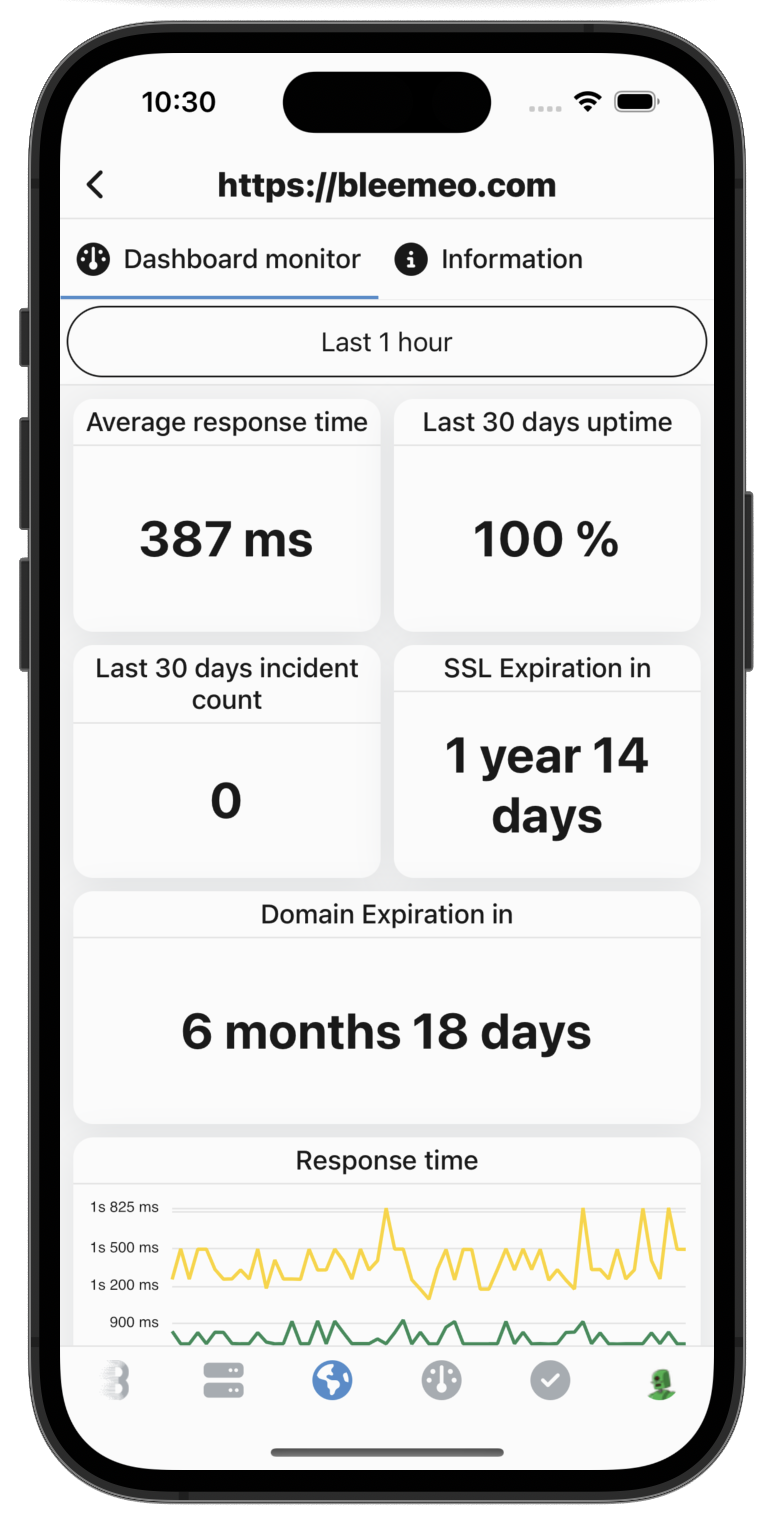
Section titled “Uptime Monitors”Track the availability and performance of your external services with the monitors section:
- View uptime statistics for all your monitors
- Check response times from different probe locations
- Identify availability issues quickly
Event Timeline
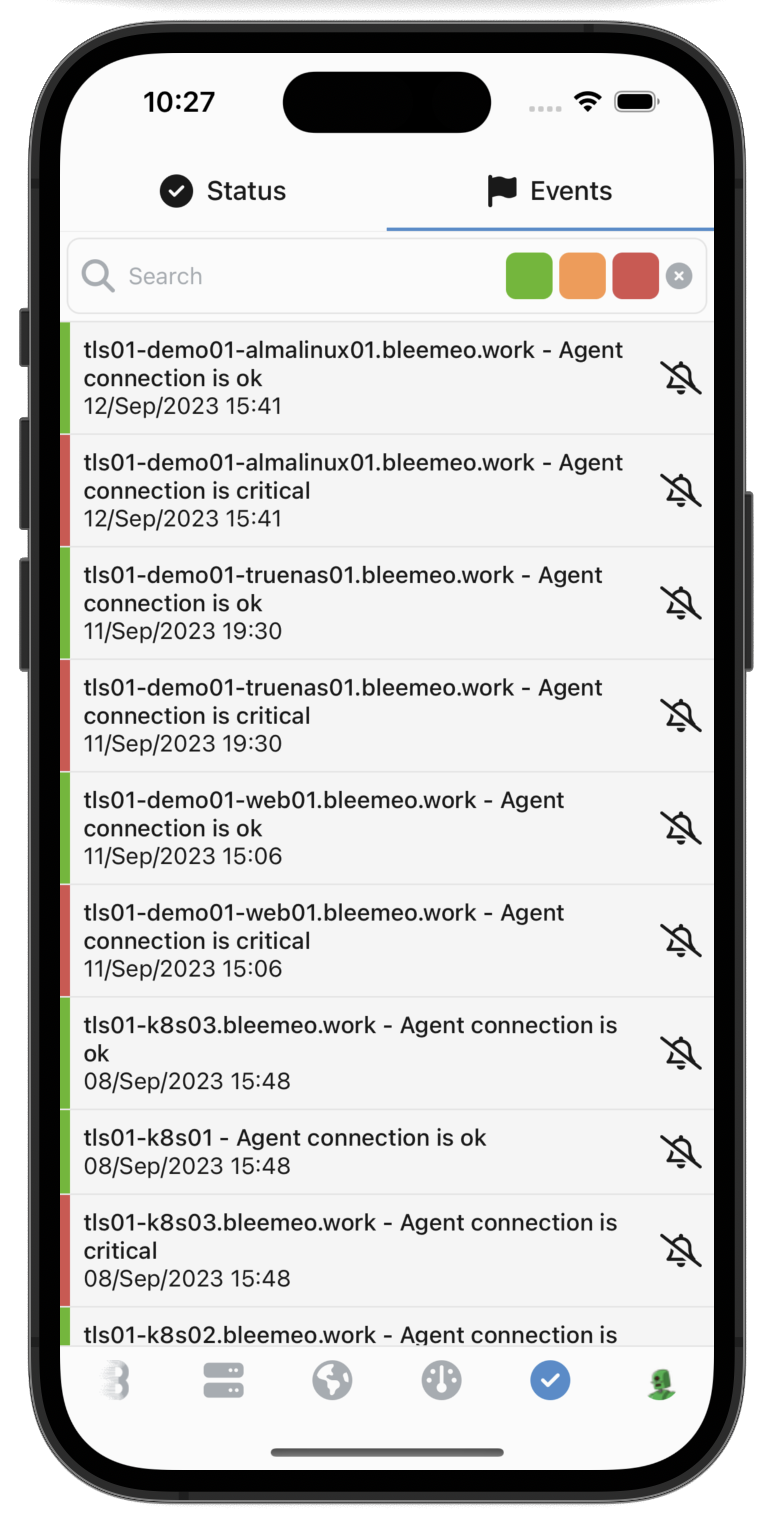
Section titled “Event Timeline”The events section provides a complete history of everything that happened in your infrastructure. Use it to:
- Investigate incidents by checking what events occurred before an issue
- Search and filter events by type, severity, or time range
- Understand patterns in your infrastructure behavior
Get Started
Section titled “Get Started”Download the Bleemeo mobile app and sign in with your existing Bleemeo account credentials. All your infrastructure data will be immediately available.