

Agent Dashboard
On this page you can see a list of your agents.
For each agent you can see whether it is currently online, the server name, the values of the main metrics, and the list of services with their status indicated by color.
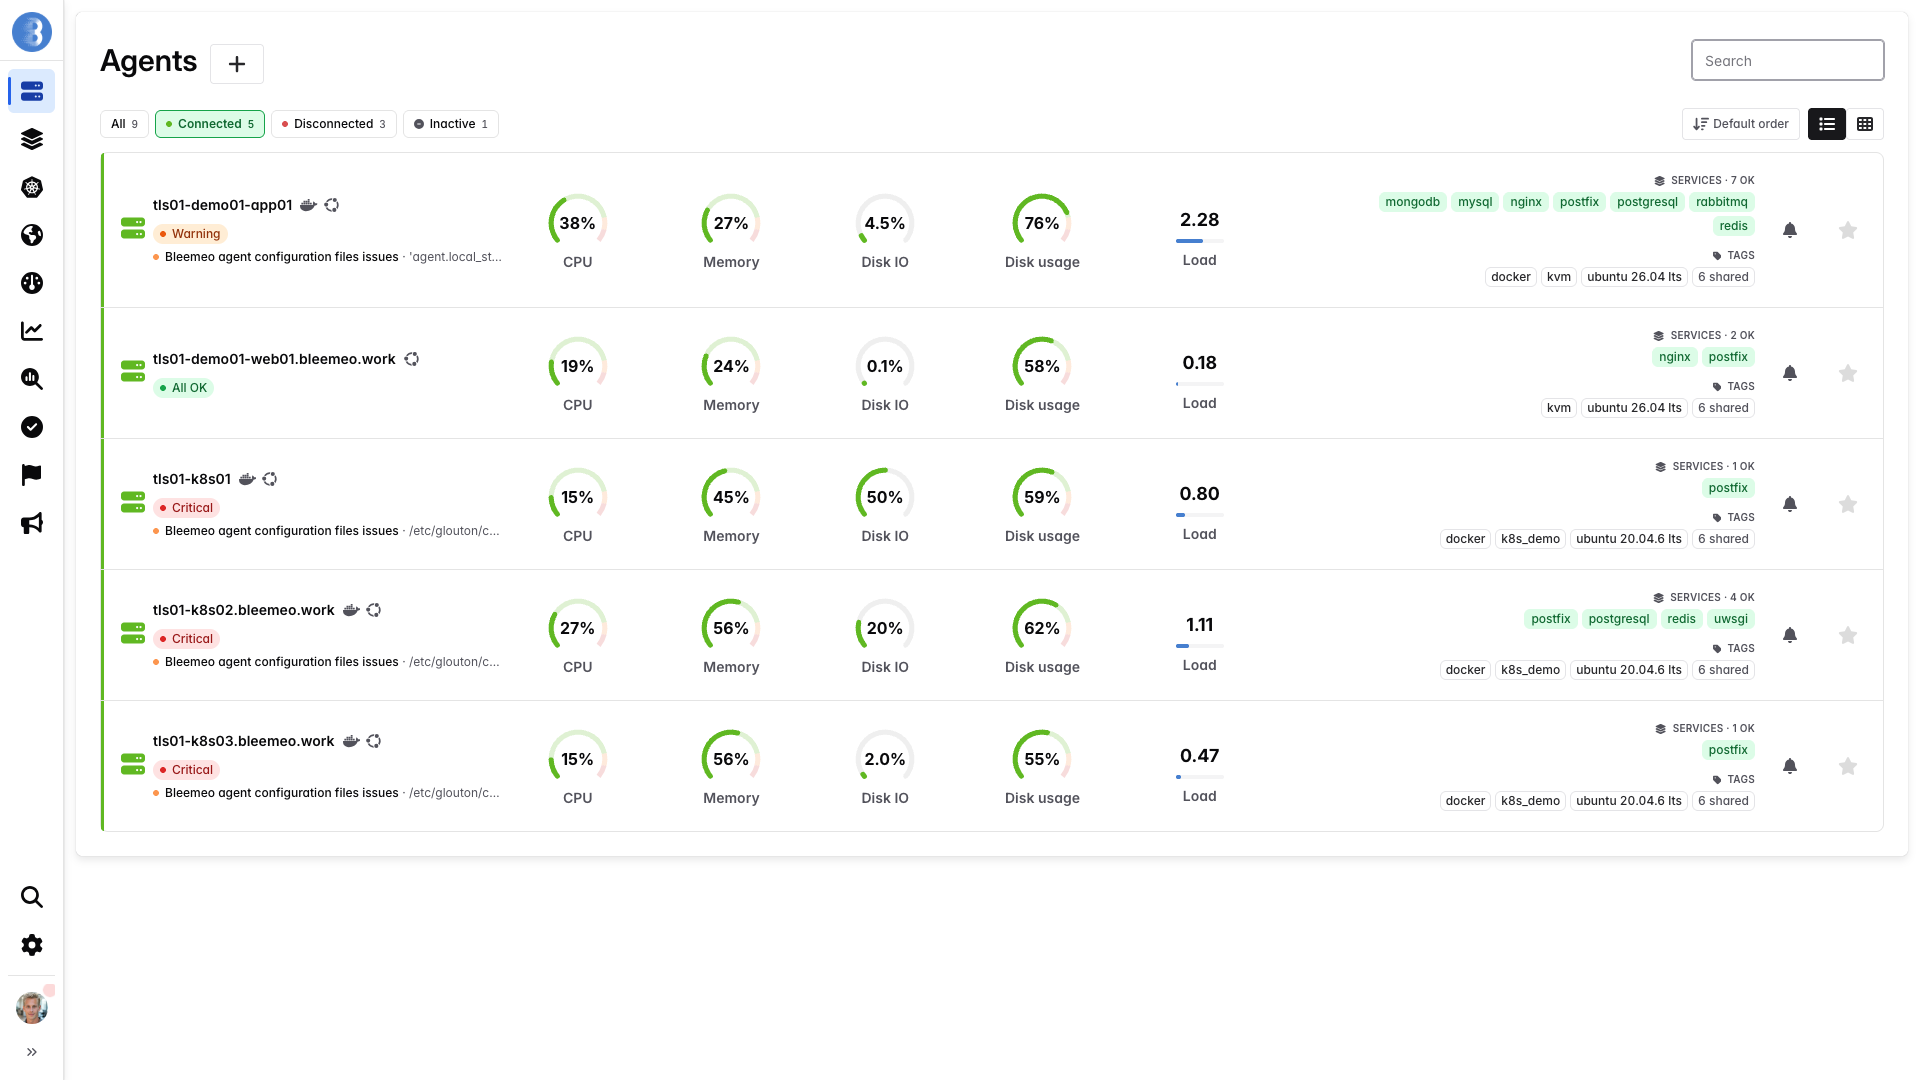
If you click on the server name, you access a new page with 7 tabs for this agent.
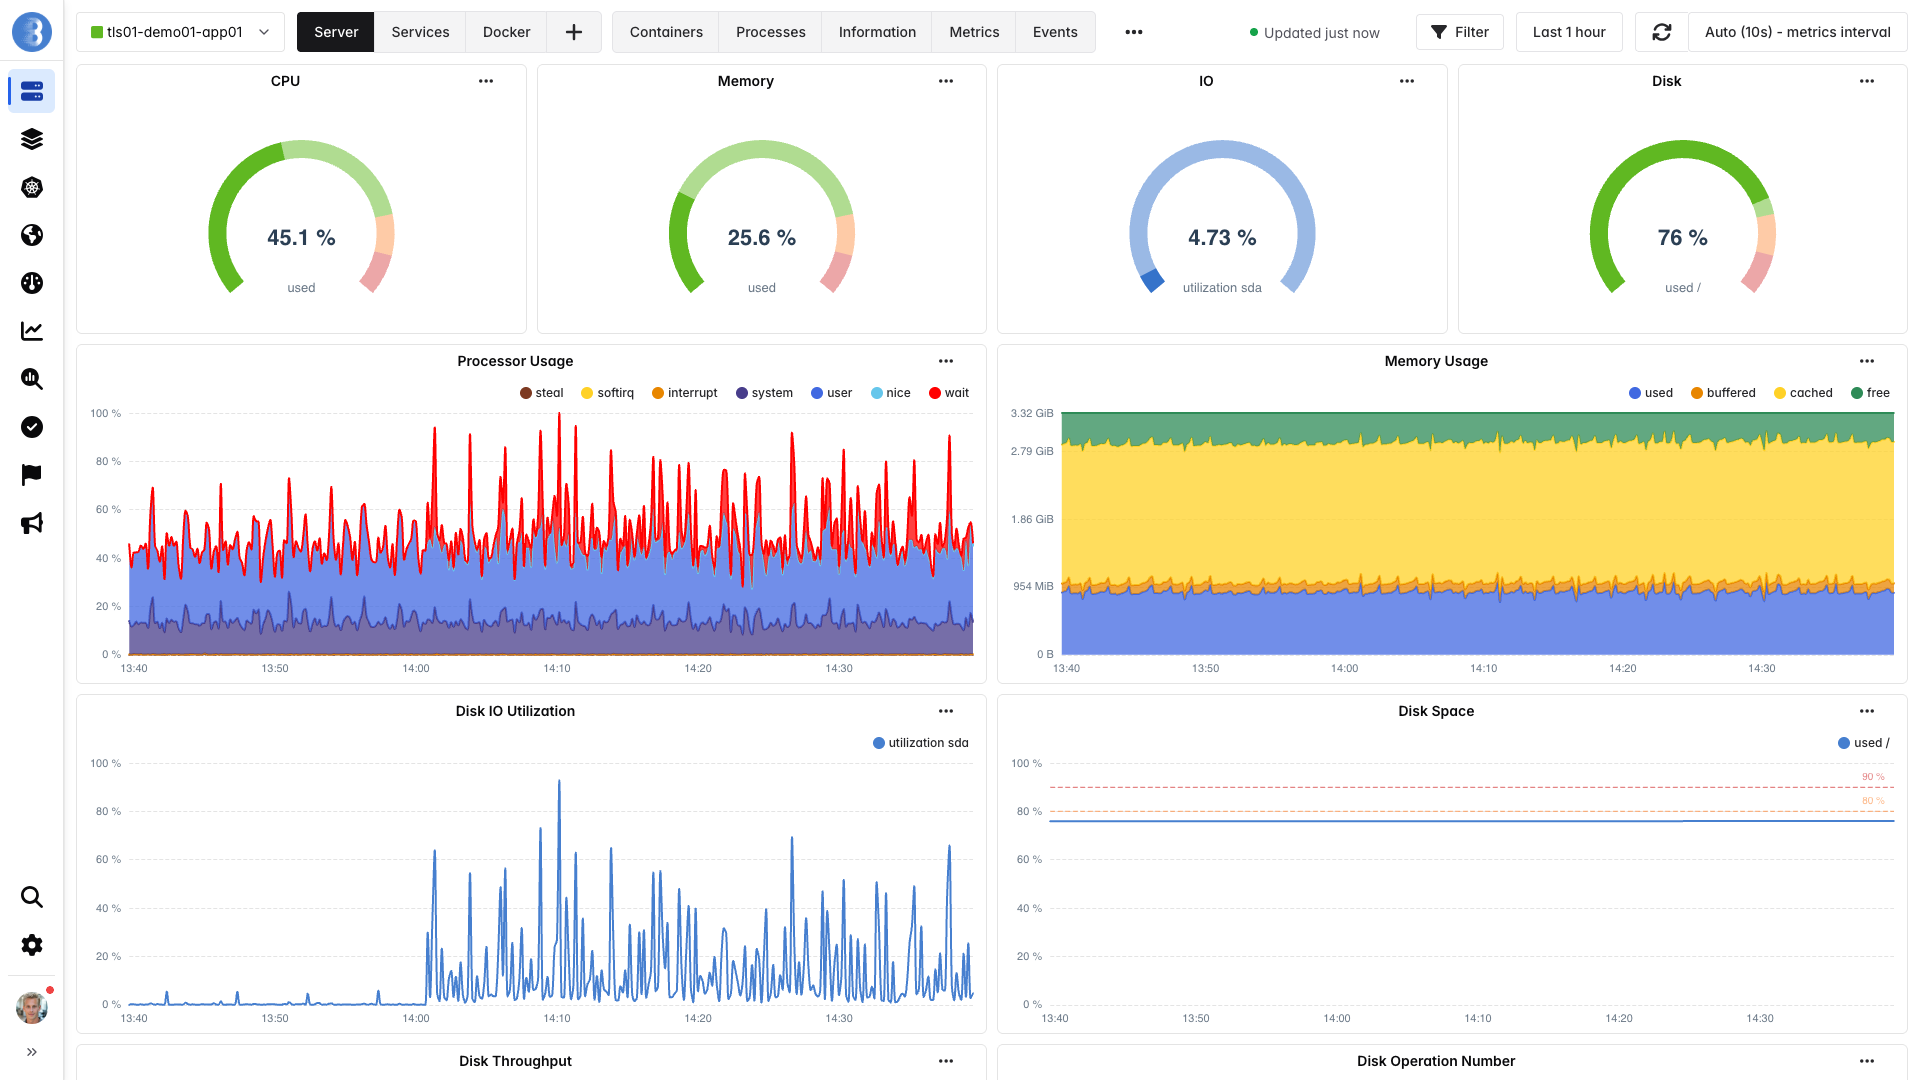
Service Dashboards
Section titled “Service Dashboards”Beyond the agent’s own dashboard, Bleemeo proposes a dashboard for each service. Each supported service has a layout of its own, and it is offered once two things are true: Glouton has detected the service, and is actually sending at least one of the metrics the layout graphs.
That second condition is why a service can be detected and visible in the services list without its dashboard appearing. It usually means the metrics are missing: the service page’s Metrics are Missing section is the place to start, or Troubleshoot a Service Check or Missing Metrics.
Most services have a dashboard of their own, see Services Monitoring for what each of them collects. If your service doesn’t have one, you can request it from us or build it yourself.