Web Interface
The Bleemeo agent runs a local web interface you can reach at http://localhost:8015, which provides a quick overview of your server’s health.
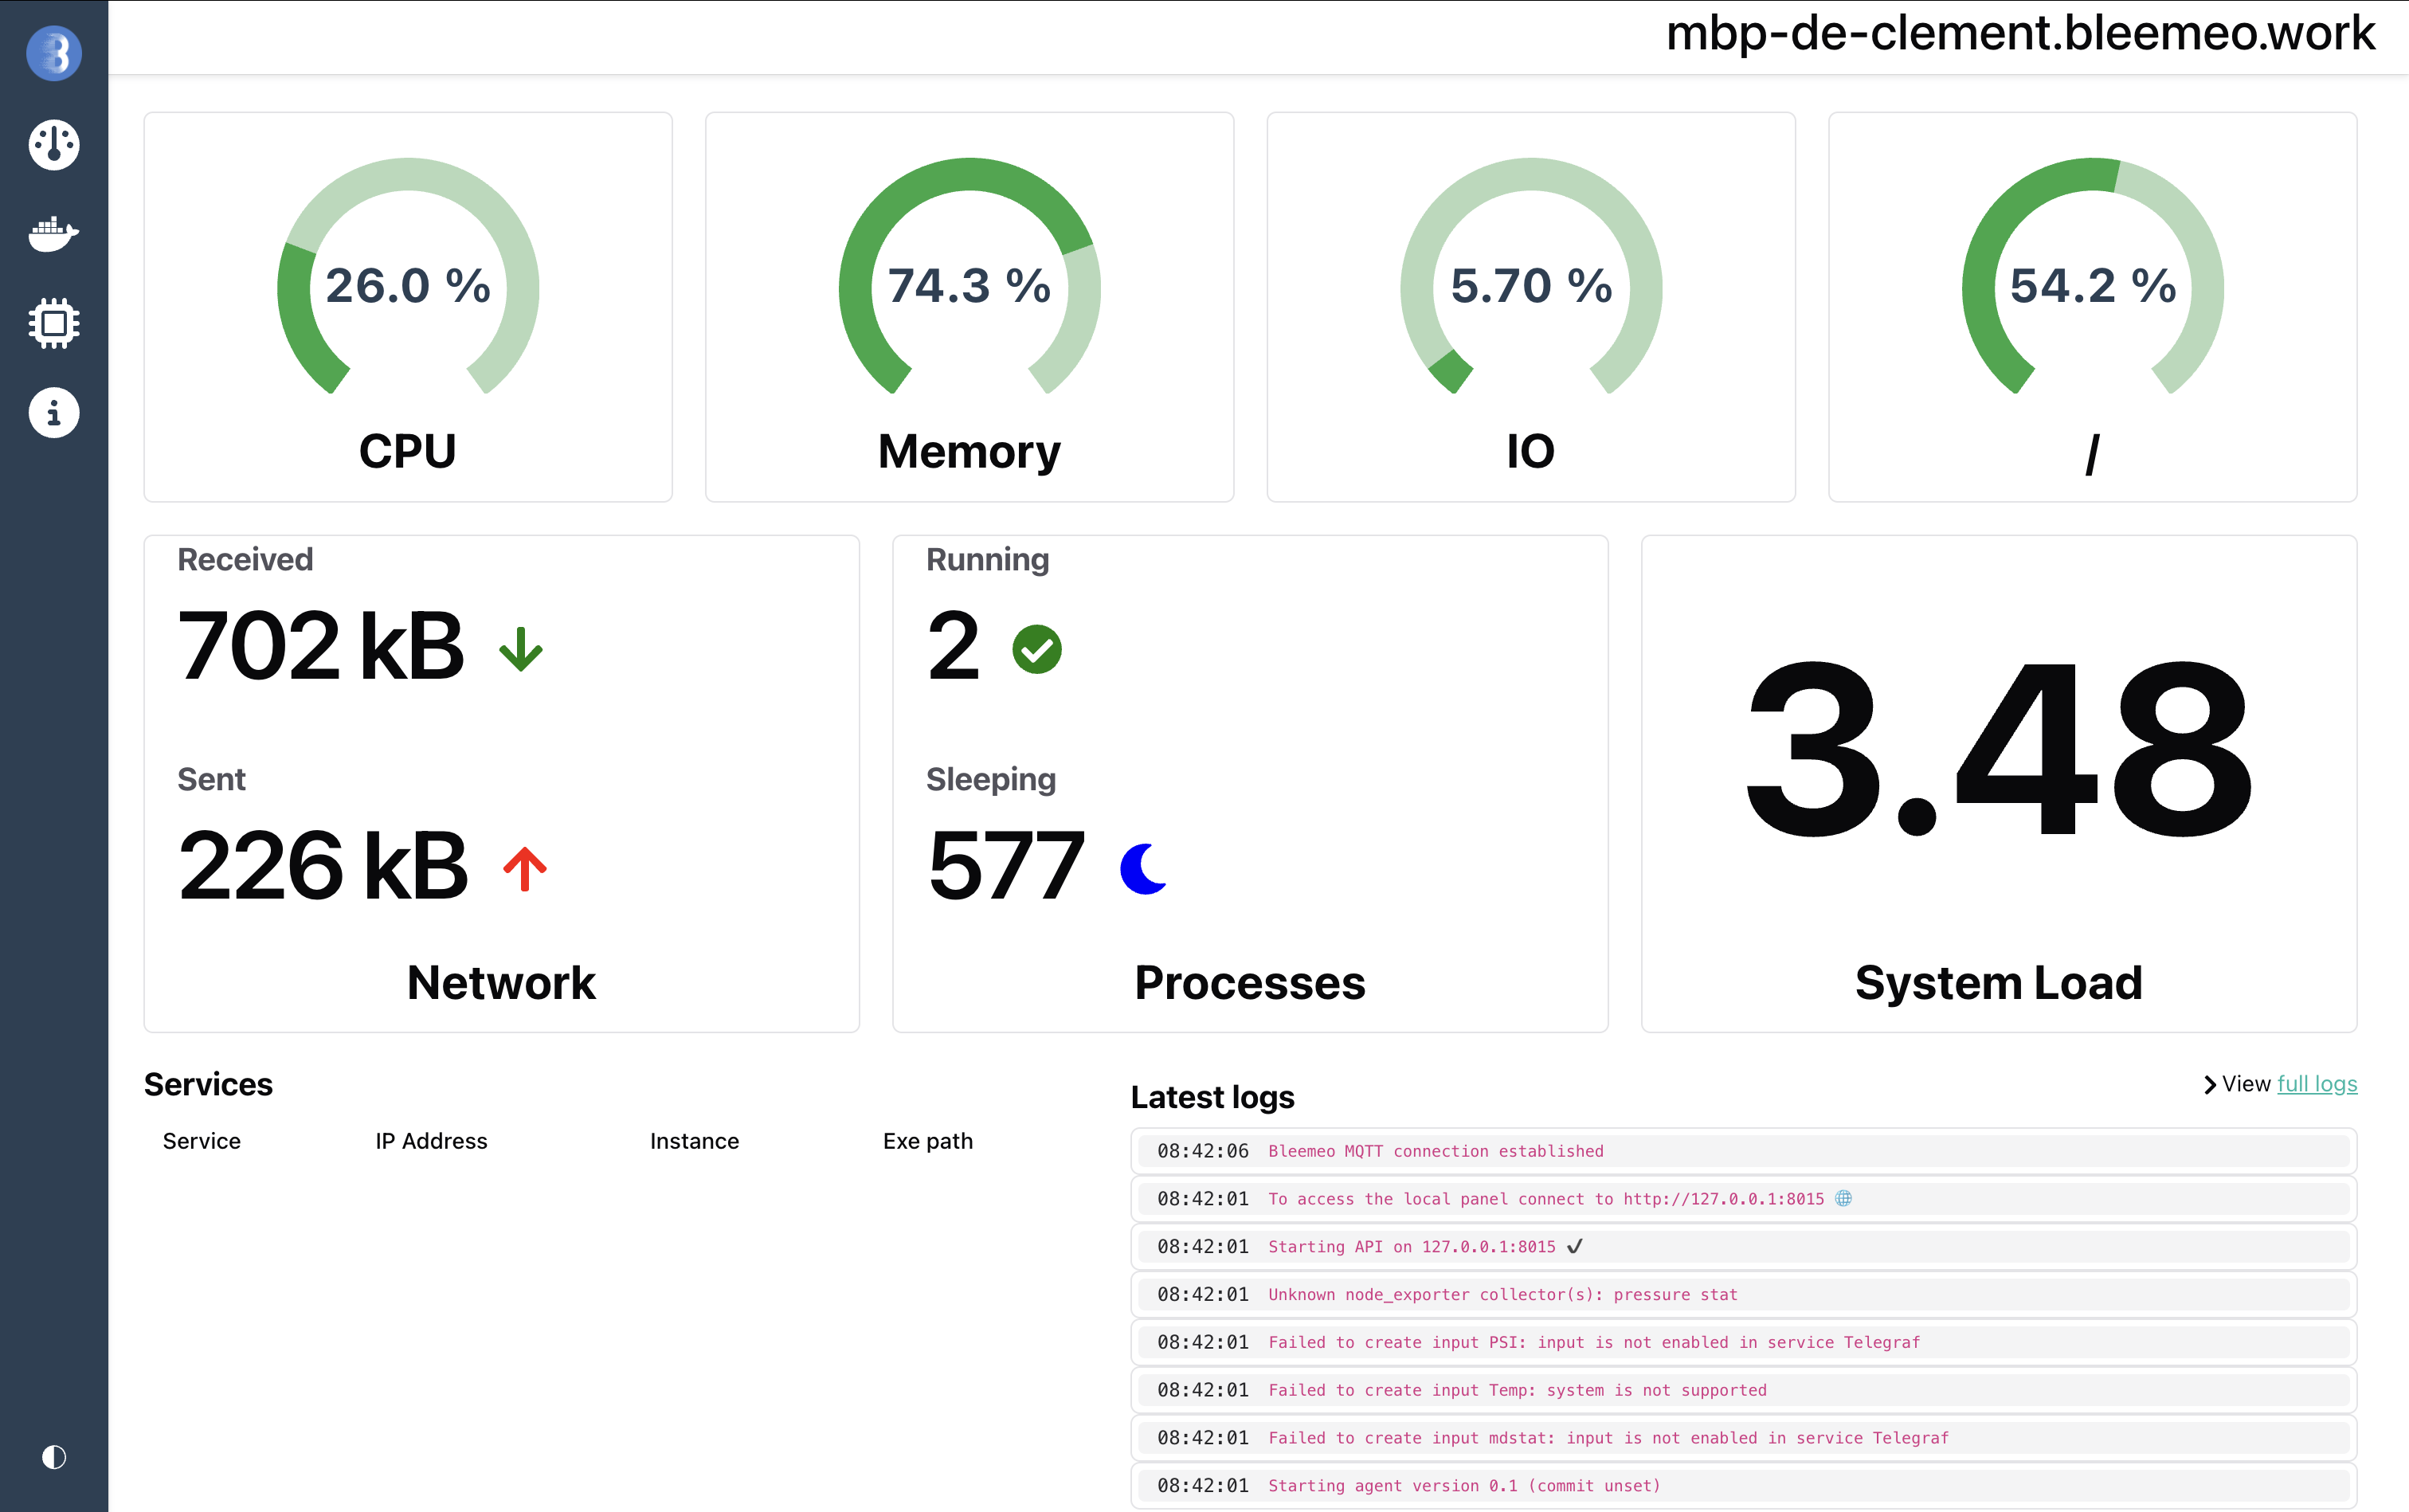
This interface is read-only and listens on localhost only by default. You may disable it with the web.enable setting in the agent configuration.
Uptime Monitoring tab
Section titled “Uptime Monitoring tab”When at least one HTTP, TCP, ICMP, DNS or SSL target is declared under blackbox.targets, the local UI exposes a dedicated Uptime Monitoring tab. Each configured monitor gets a card showing:
- current up/down status (with a short failure reason when down: TLS error, DNS failure, HTTP status code, body mismatch, or timeout)
- a 24-hour
probe_successsparkline - uptime percentage over the same window
- p95 response time over 24 hours
- days until certificate expiry for HTTPS targets
The page also shows a KPI row (count of monitors up, average uptime, currently-down list) and a banner that lists certificates expiring within 14 days.
Clicking a card opens a drawer with the per-monitor availability
stripe, a recent failures list with probable cause, response time
chart, HTTP phase breakdown (resolve / connect / TLS / processing
/ transfer), HTTP status code timeline, and the full TLS
certificate detail when applicable. The drawer URL is shareable
(http://localhost:8015/monitors/<monitor-name>).
Monitors provisioned from Bleemeo Cloud are also listed here and are visually flagged with a “Bleemeo” badge to distinguish them from local-config targets.
History beyond the in-memory window (3 minutes) requires the local TSDB to be enabled — see agent.local_store.enable.
Other endpoints
Section titled “Other endpoints”The local web server also exposes:
- /metrics: a Prometheus compatible exporter of all metrics gathered by Bleemeo agent
- /metrics?onlyMonitors: the
raw
probe_*metrics from the blackbox prober. Probes are excluded from the plain/metricsoutput by default because they trigger network calls; use this flag (or?includeMonitorsto mix in everything else) when scraping Glouton’s monitor data from an external Prometheus. - /diagnostic: a diagnostic page that can be useful when troubleshooting issues.