Getting Started with Bleemeo
Bleemeo makes infrastructure monitoring simple. Install the agent, and within seconds you’ll have full visibility into your servers, containers, and applications—no complex configuration required.
What Can You Monitor?
Section titled “What Can You Monitor?”Bleemeo automatically discovers services running on your systems and collects relevant metrics. Here’s what you can monitor:
Create Your Account
Start by creating a free Bleemeo account—no credit card required.
- Go to panel.bleemeo.com/signup
- Sign up with your email, or use Google or GitHub for one-click registration
- Verify your email address
Once logged in, you’ll see your personalized installation command on the home page.
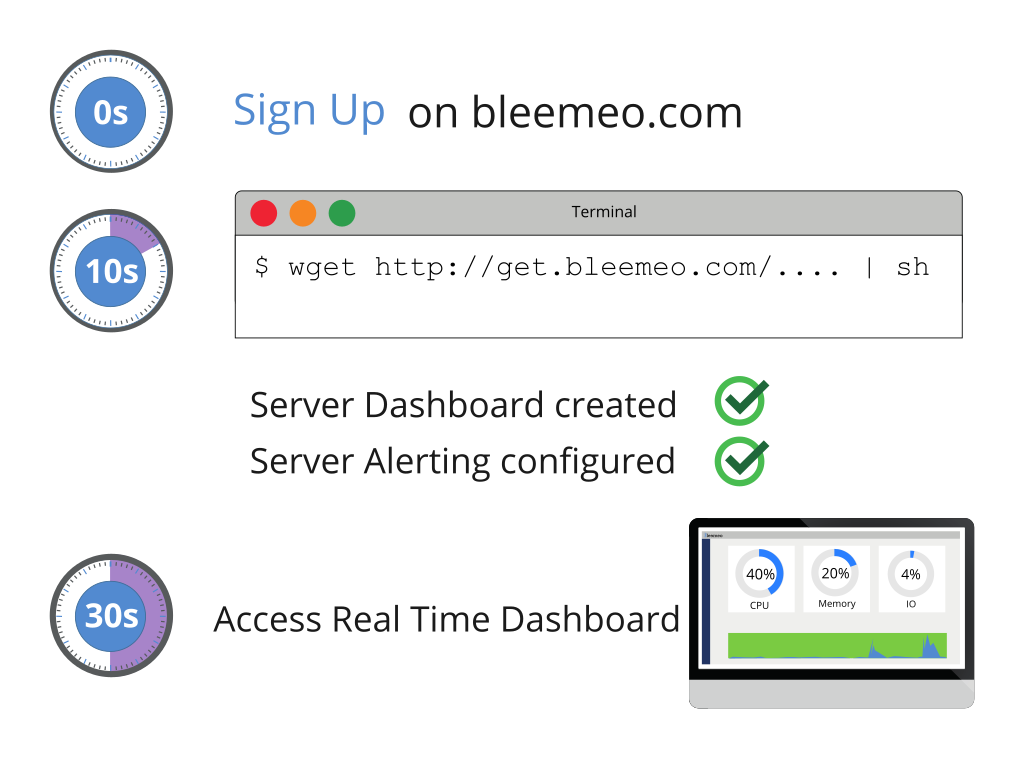
Install the Agent
Run the installation command shown on your dashboard. It looks like this:
wget -qO- "https://get.bleemeo.com?accountId=YOUR_ID®istrationKey=YOUR_KEY" | shThis single command will:
- Add the Bleemeo package repository
- Install and configure the agent for your account
- Start the agent and begin collecting metrics
- Automatically discover services running on your server
For other installation methods (Docker, Kubernetes, Windows), see the detailed installation guide.
Invite Your Team
Collaborate with your team by adding users to your account:
- Go to Users Management
- Click the + button and enter their email address
- They’ll receive an invitation to set their password
User roles:
- Admin — Full access including account settings and user management
- Manager — Can manage agents, dashboards, and alerts (but not users)
- Viewer — Read-only access to dashboards and metrics
Configure Alerts
Bleemeo comes with smart default thresholds for critical metrics like CPU, memory, and disk usage. When thresholds are exceeded, you’ll receive notifications.
Customize your alerting:
- Go to Notifications
- Add notification recipients (email, Slack, PagerDuty, etc.)
- Configure which alerts trigger notifications
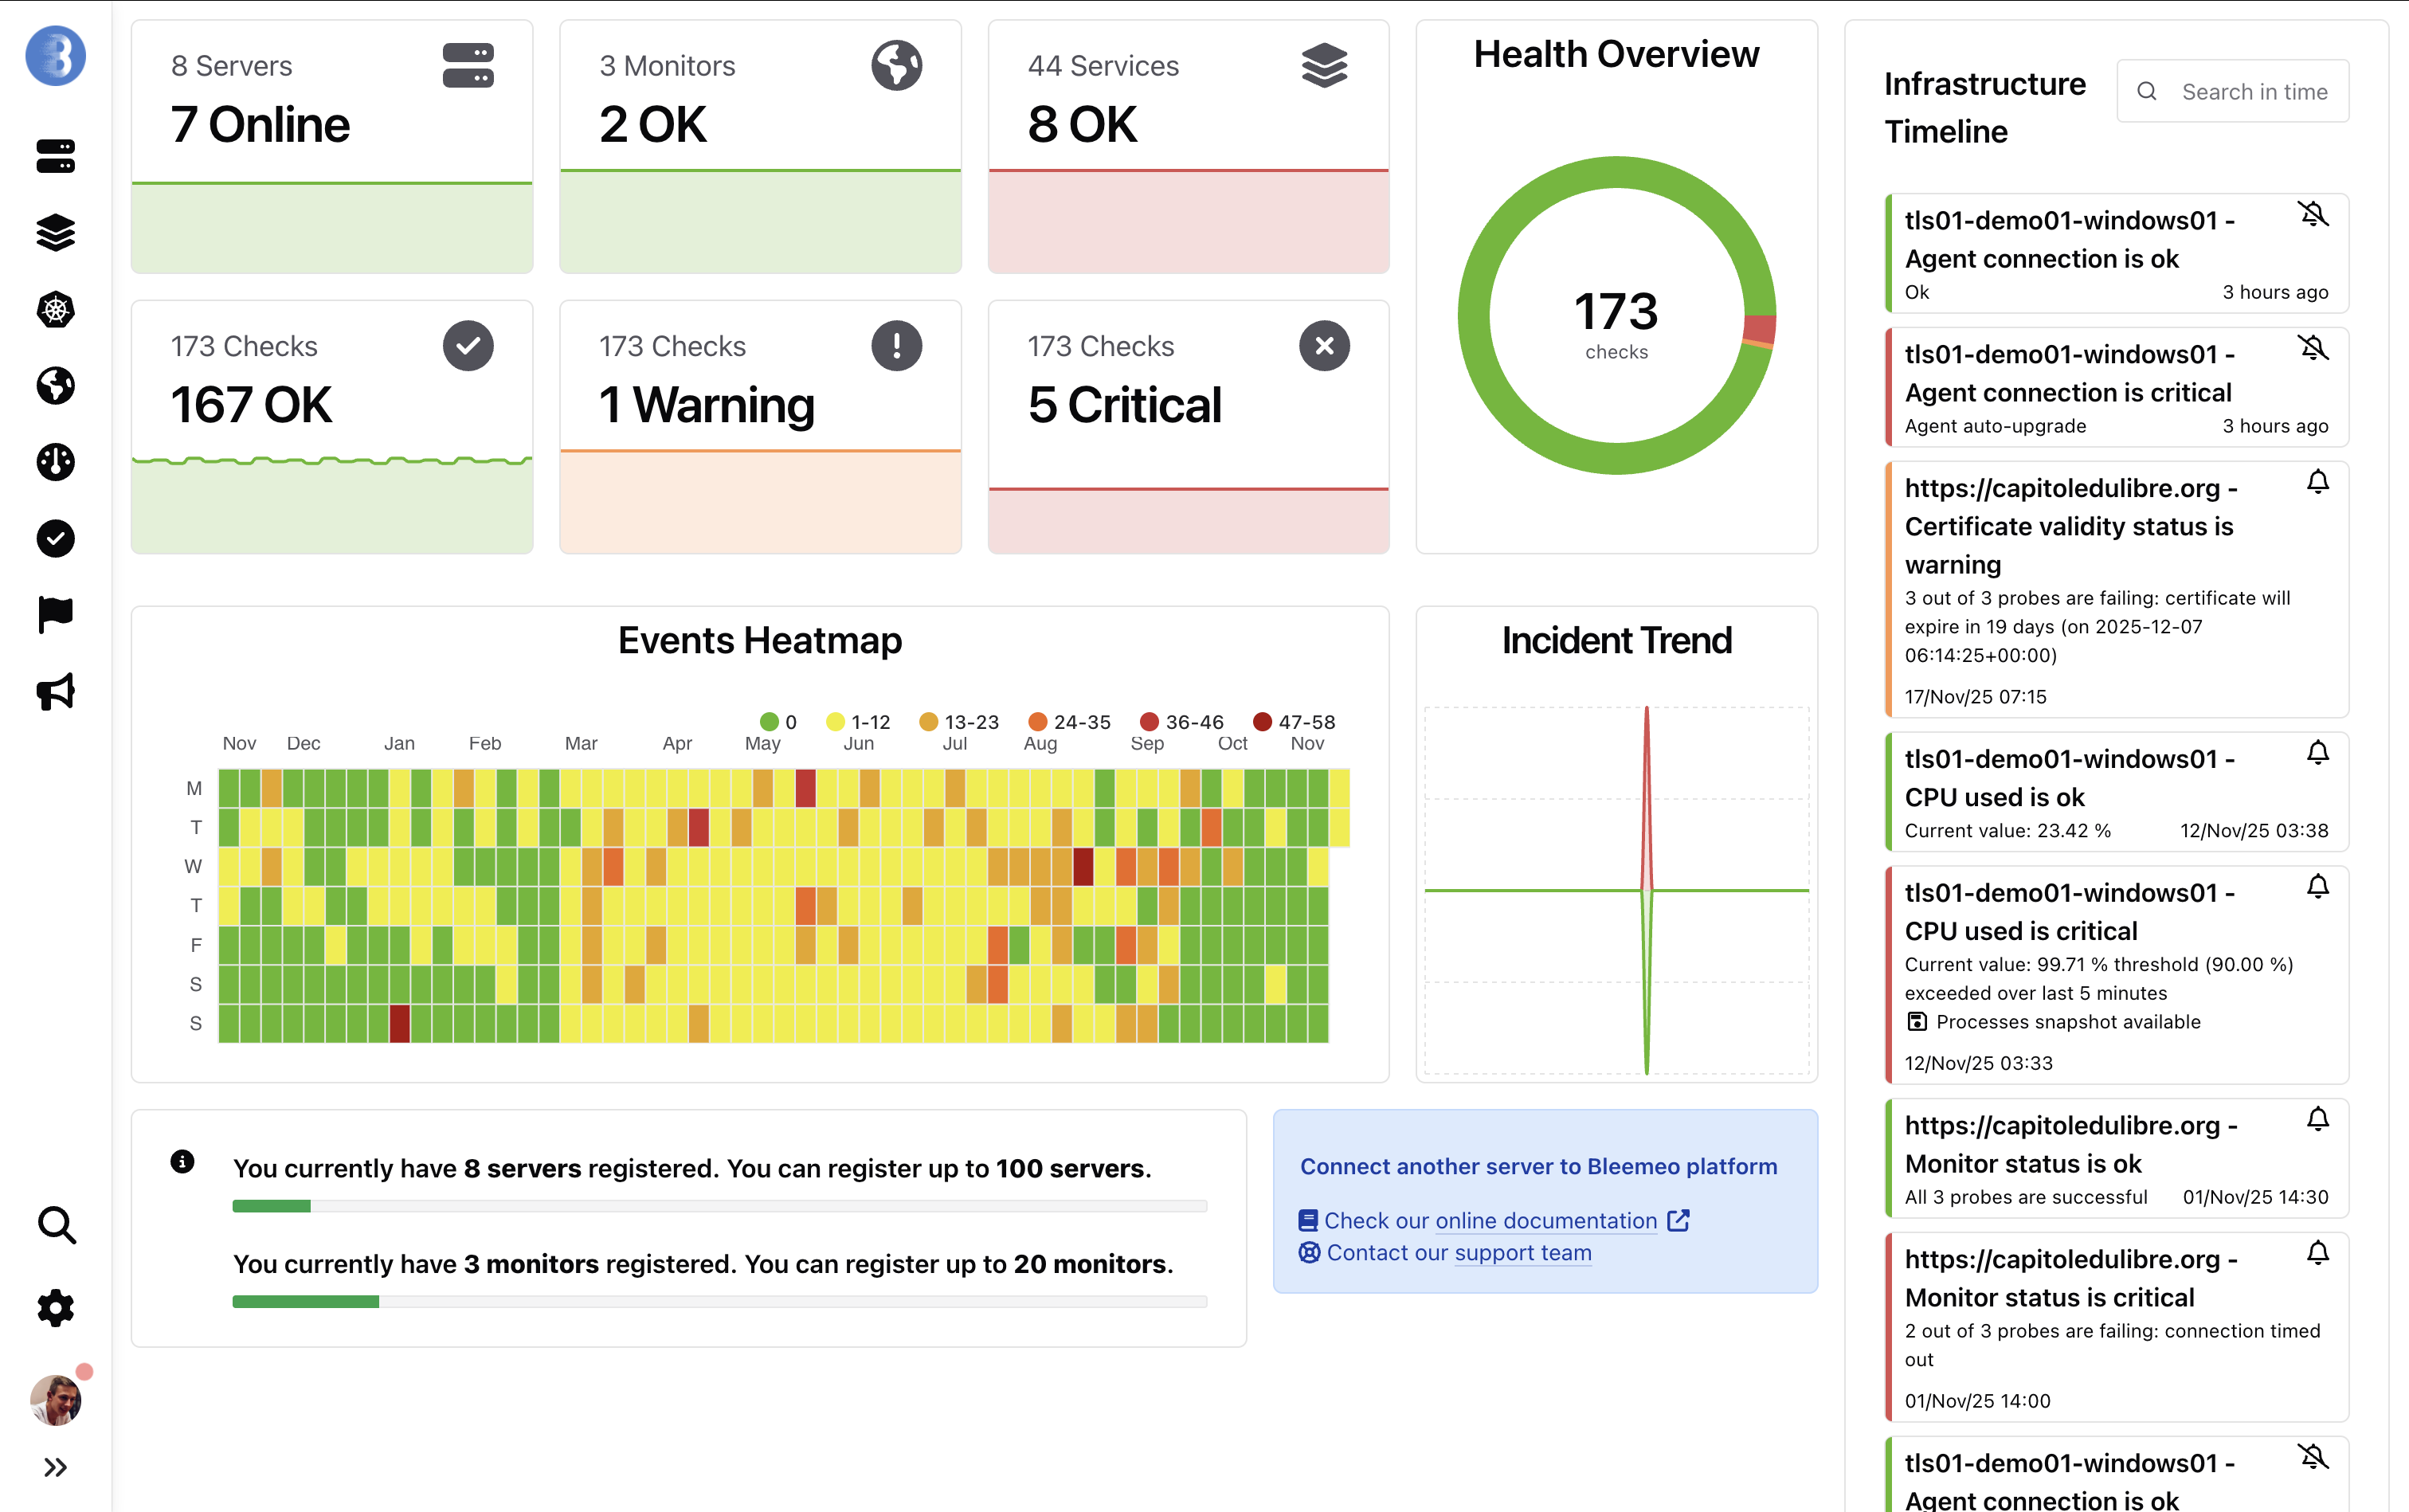
Your Dashboard
Section titled “Your Dashboard”Once everything is set up, you’ll have access to a comprehensive dashboard showing the health of your entire infrastructure:
Next Steps
Section titled “Next Steps”- Agent Configuration — Fine-tune agent settings
- Custom Dashboards — Build dashboards for your specific needs
- Uptime Monitoring — Monitor external services and URLs
- Mobile App — Monitor on the go with iOS and Android apps