Monitor Dashboards
Free
Starter
Professional
Monitor List
Section titled “Monitor List”On this page you can see a list of monitors. You can see your monitor list.
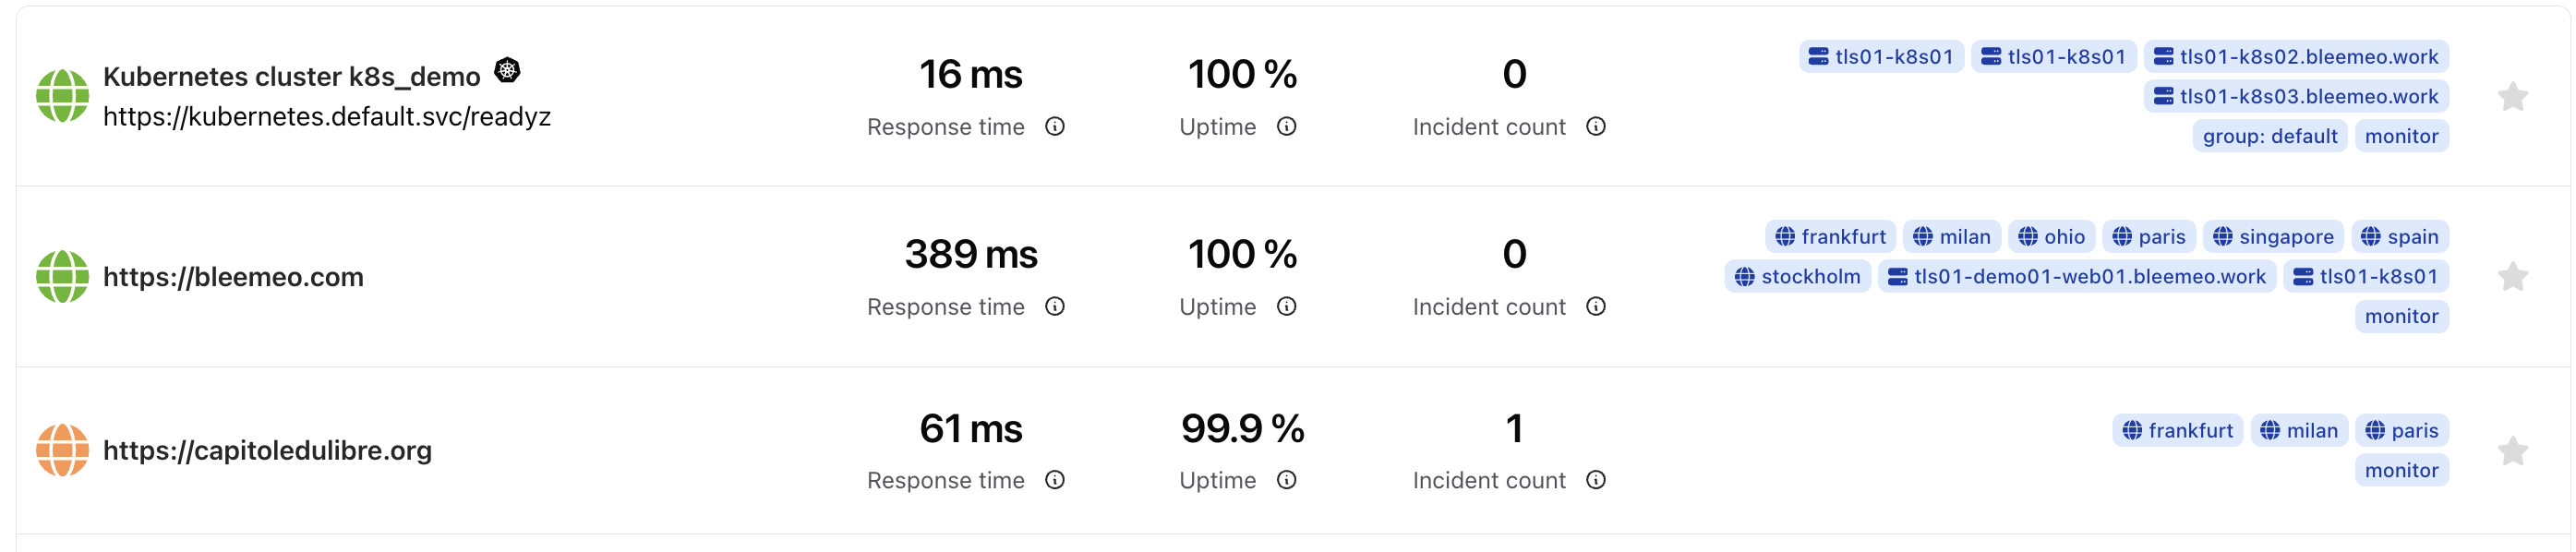
On the list of monitors, you can see one box per monitor. Each of these boxes has:
- The URL of the monitor
- Average response time
- Last 30 days uptime (%)
- Last 30 days incident count
- Public/Private probes selected
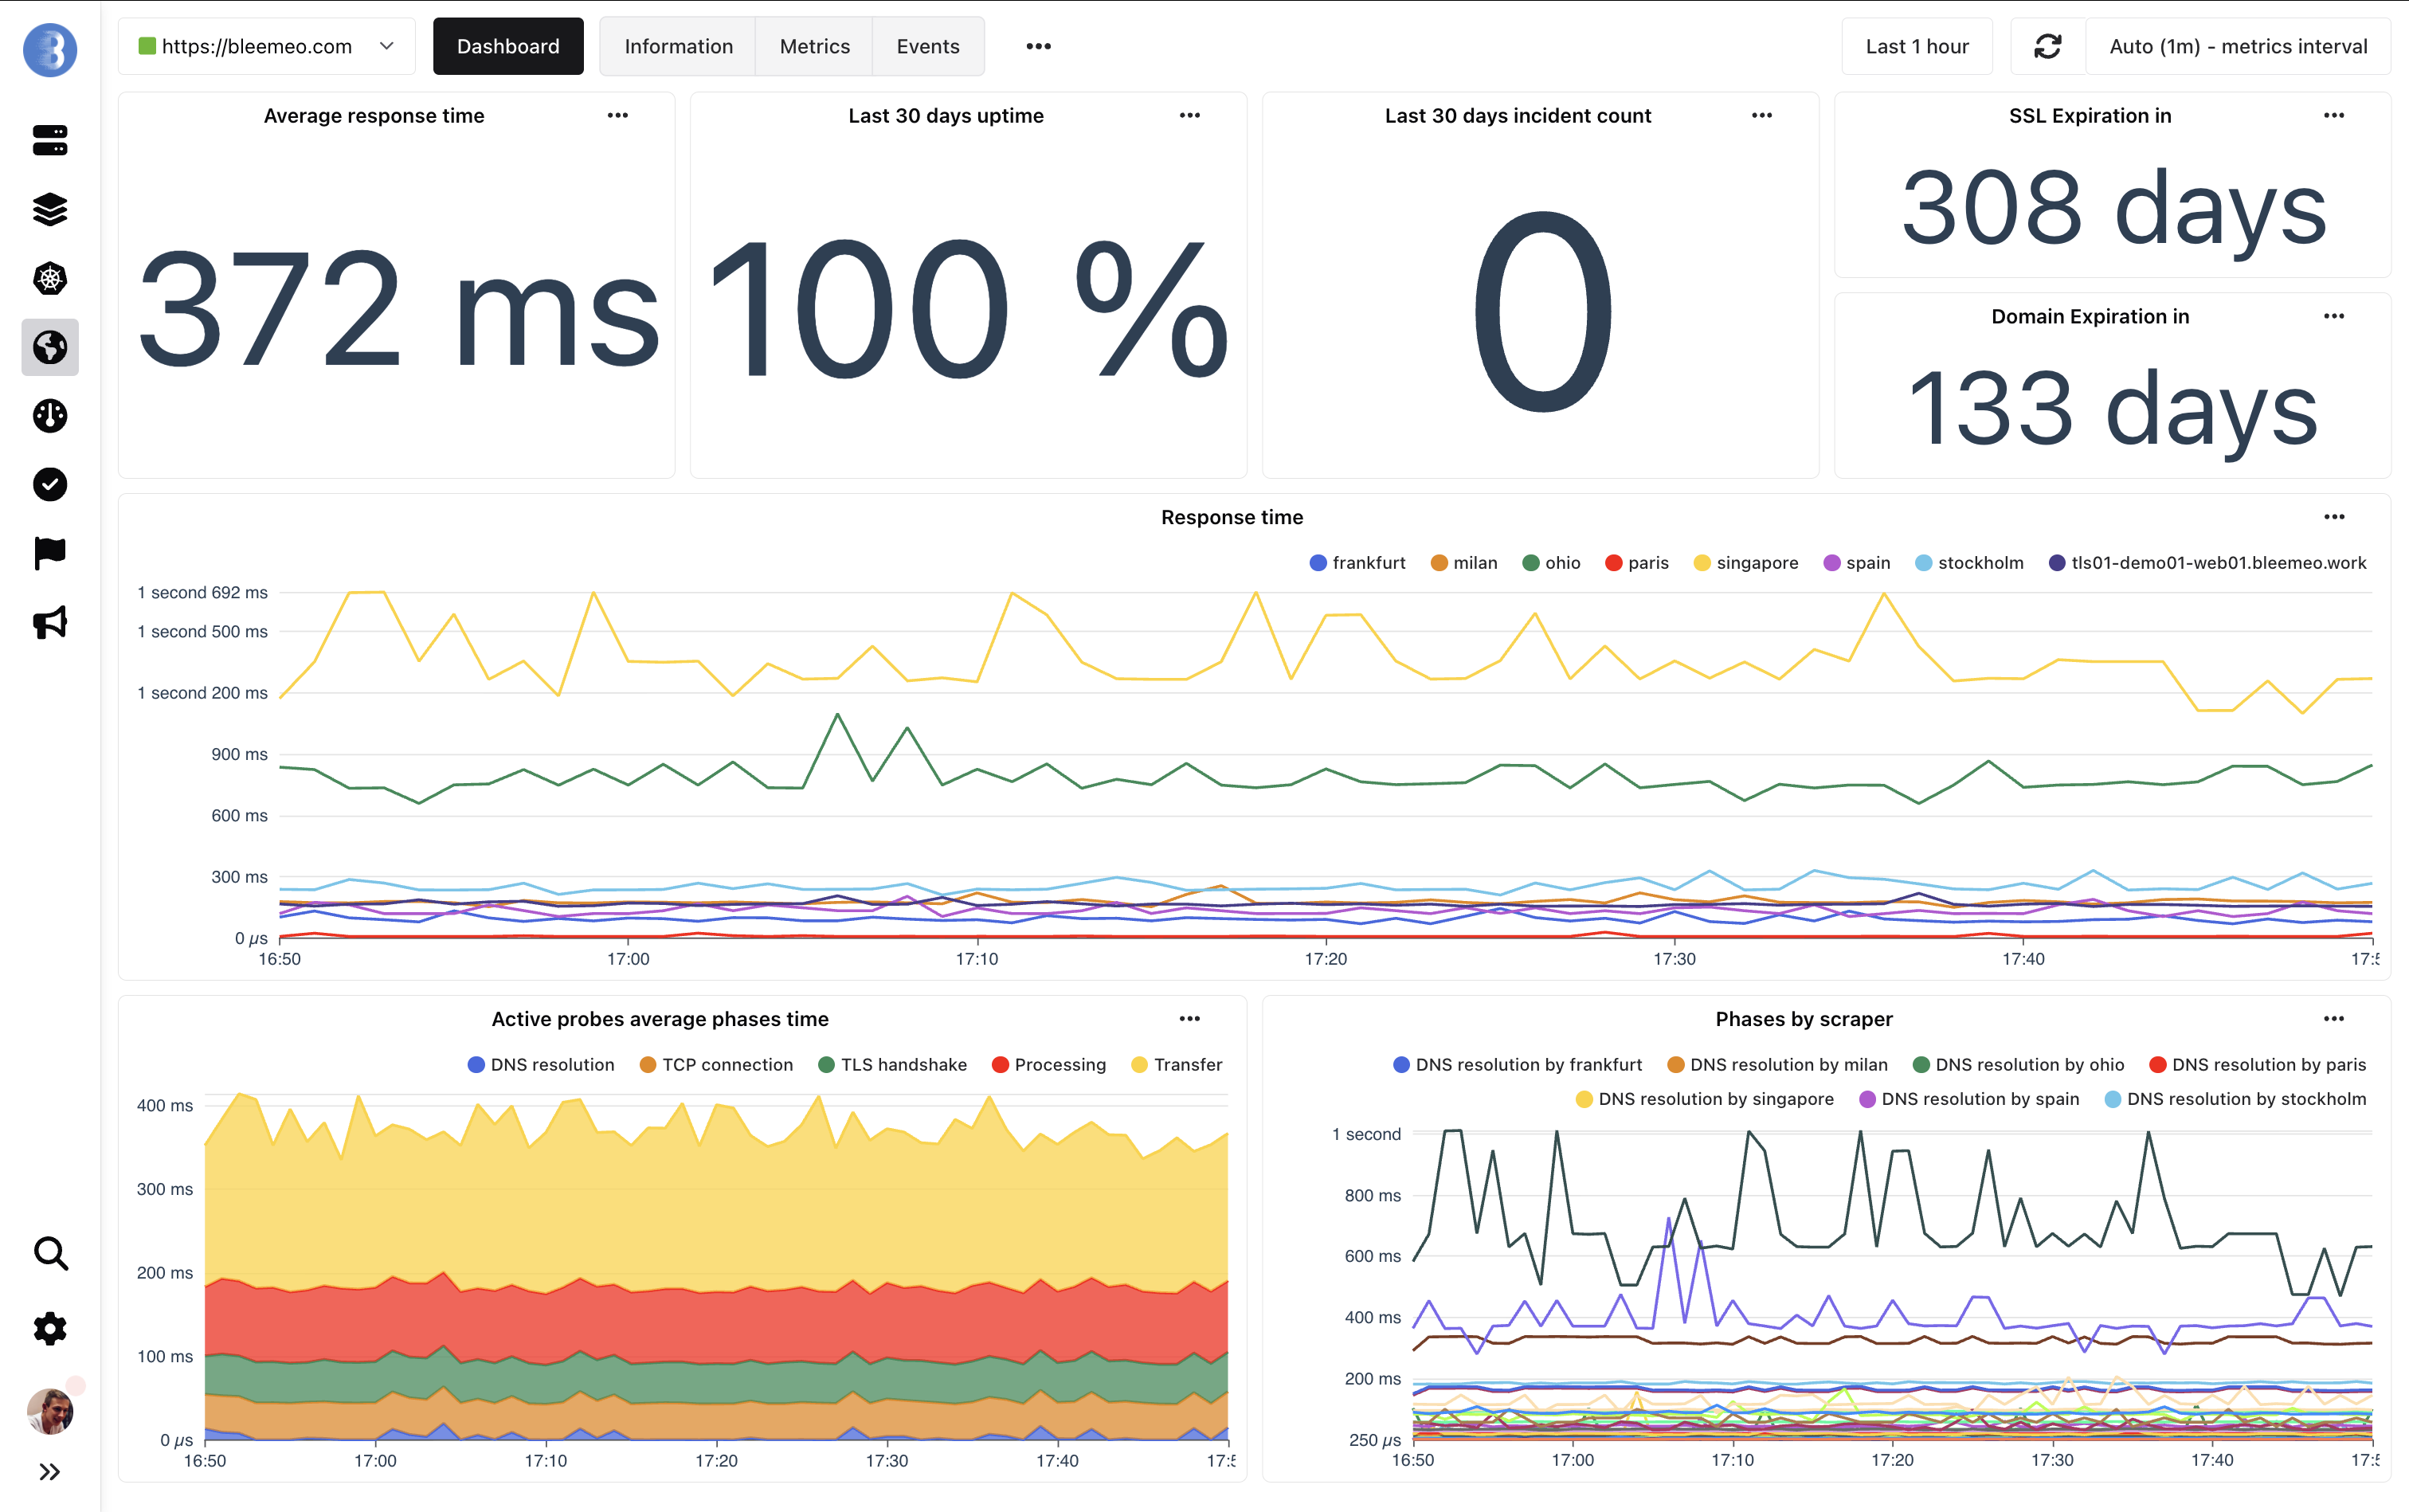
Monitor Dashboards
Section titled “Monitor Dashboards”The monitor dashboard is a dashboard template; it is customizable in the dashboard template tab.
By default, you have the metrics you’ll find in the list, plus the following metrics:
- SSL expiration
- Domain expiration
- Response time by scraper
- Average response time by phase
- All phases by scraper
We display the different phases of the monitor connection:
- DNS resolution
- The client tries to resolve the domain name for the request
- TCP connection
- Client establishes TCP connection with the IP address of the monitored site
- TLS handshake (HTTPS and SSL monitor only)
- Phase where a secure communication channel is negotiated and established between the two parties
- Processing (HTTP and HTTPS monitor only)
- Client waits for the server to respond to the request
- Transfer (HTTP and HTTPS monitor only)
- Client loads the content of the response