Bleemeo Mobile Application
Stay connected to your infrastructure wherever you are. The Bleemeo mobile app gives you instant access to all your monitoring data, real-time alerts, and dashboards right from your pocket.
Key Features
Section titled “Key Features”Home Dashboard
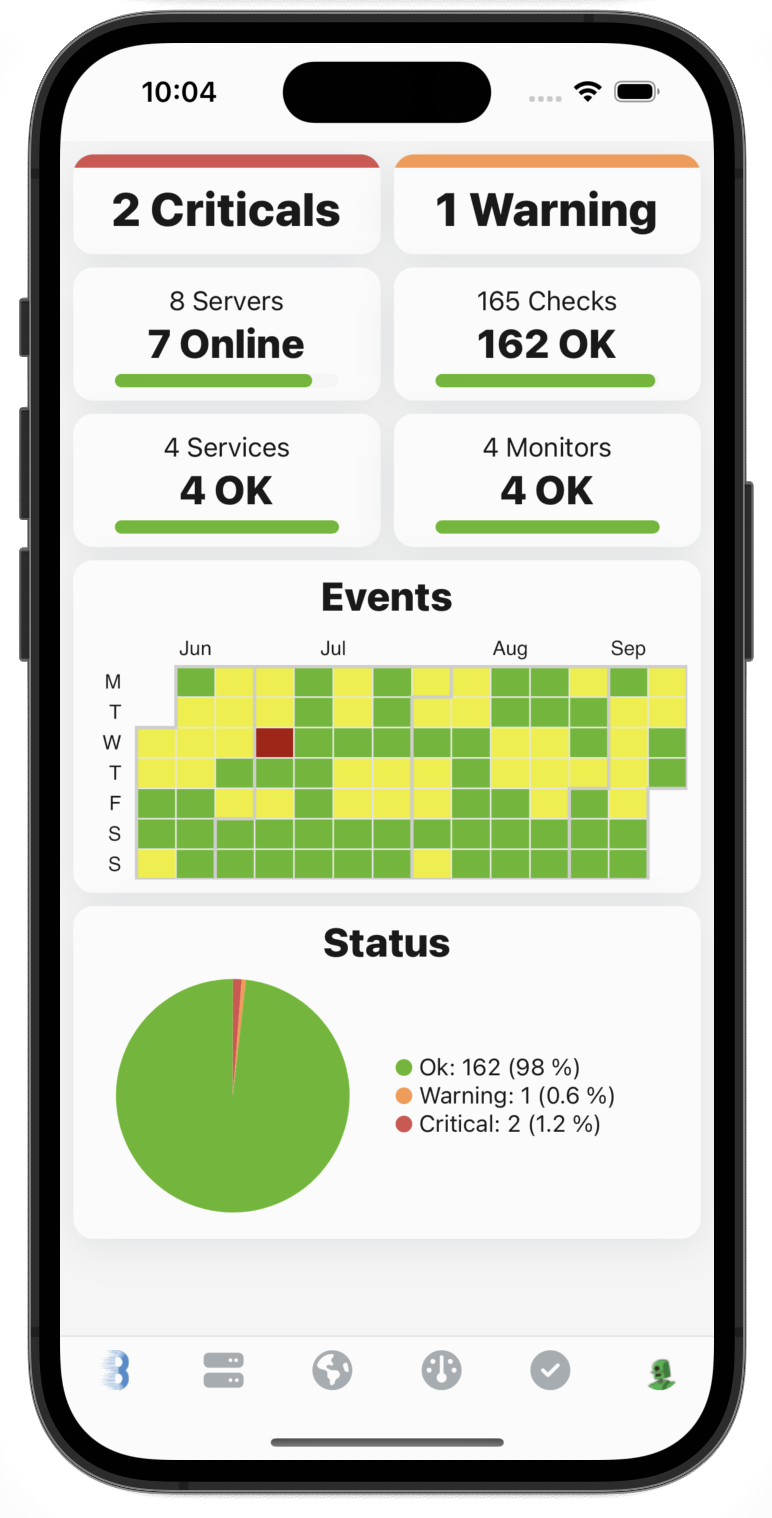
Section titled “Home Dashboard”The home screen provides an immediate overview of your infrastructure health. At a glance, you can see:
- Infrastructure heatmap showing event activity over time
- Server status with the count of healthy, warning, and critical servers
- Service status summary across all monitored services
- Quick navigation to dive into any section
Server Monitoring
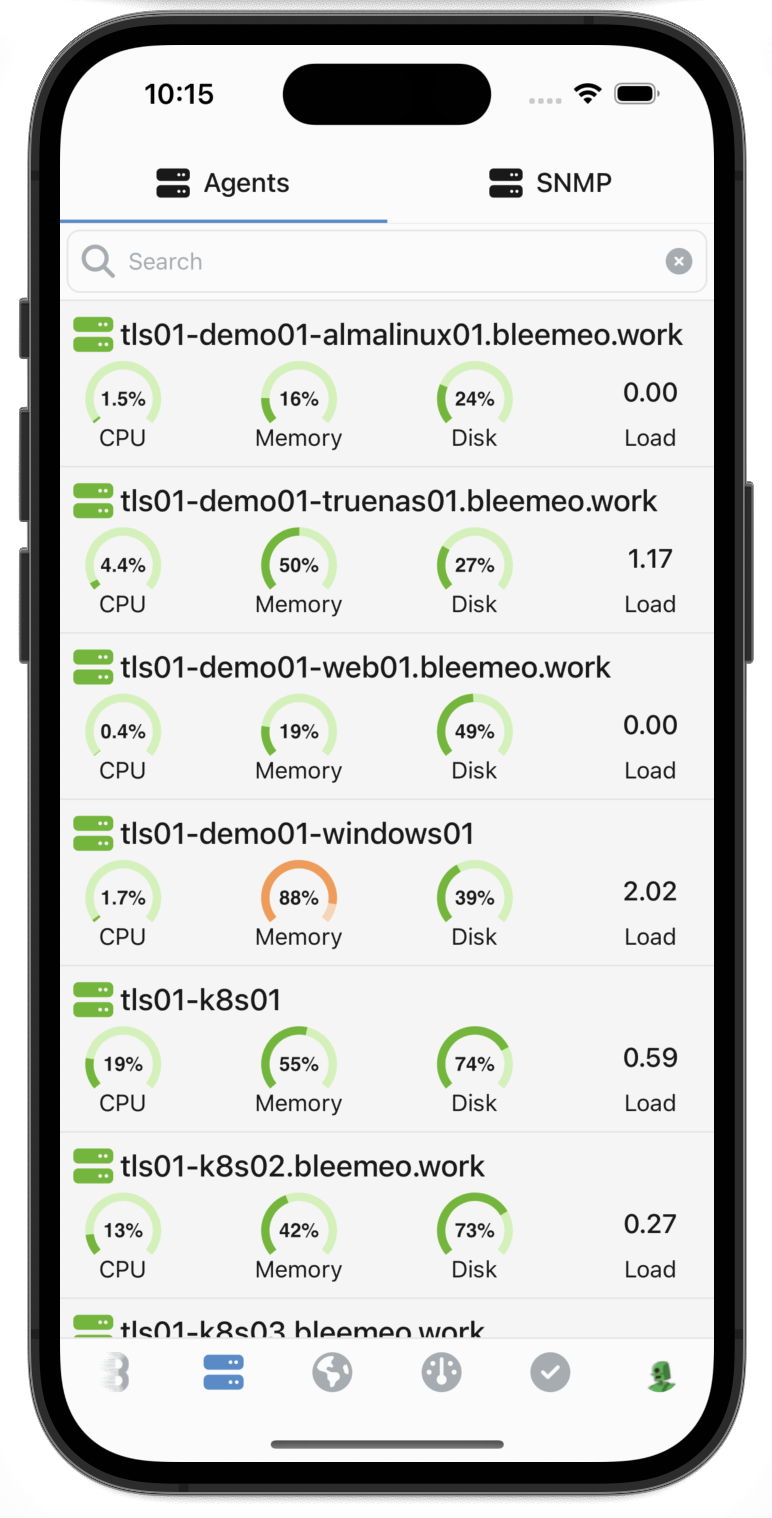
Section titled “Server Monitoring”Access detailed information about each server in your infrastructure. The server view lets you:
- Browse all your servers with instant status indicators
- View the default dashboard with key system metrics
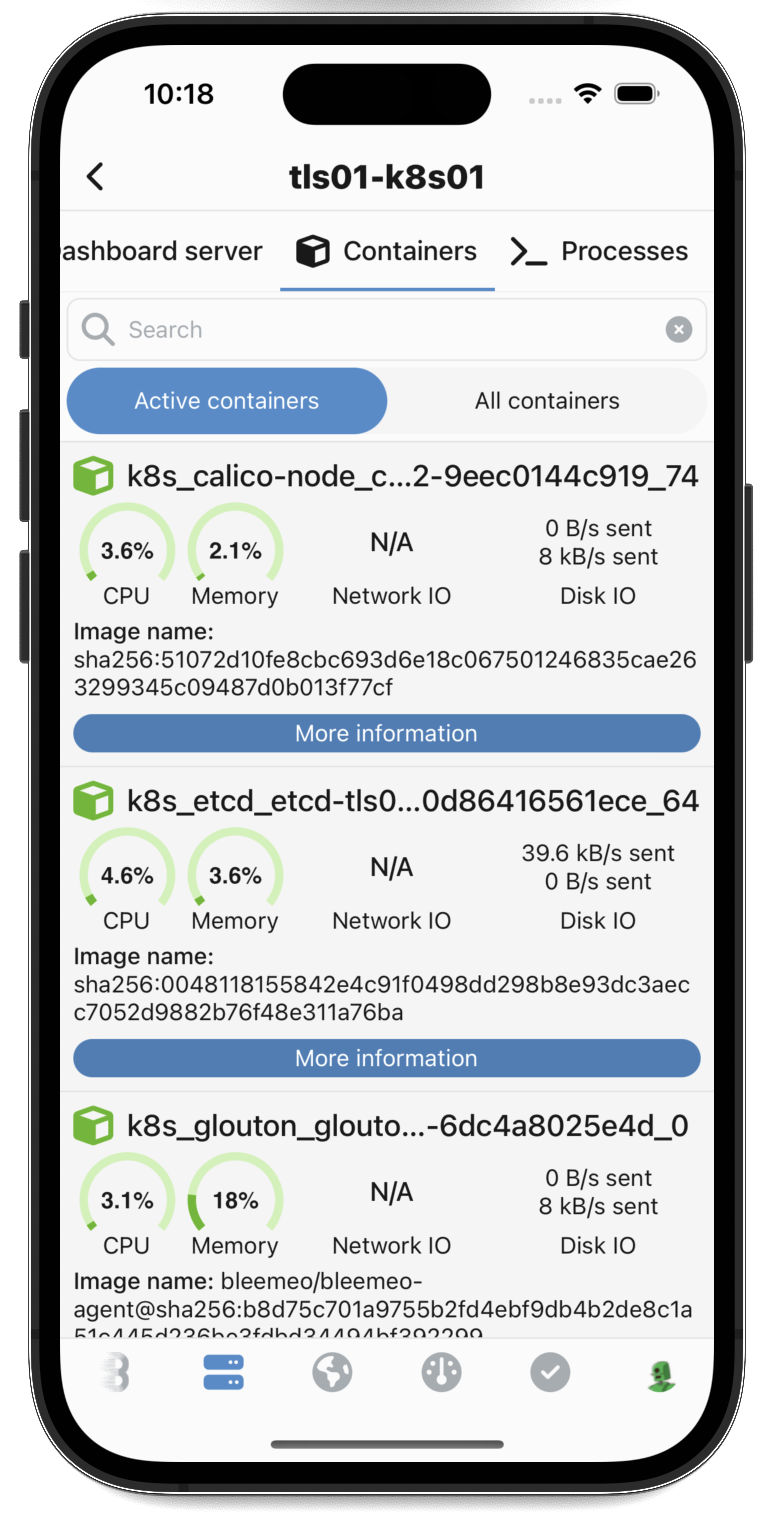
- Monitor Docker containers running on each server
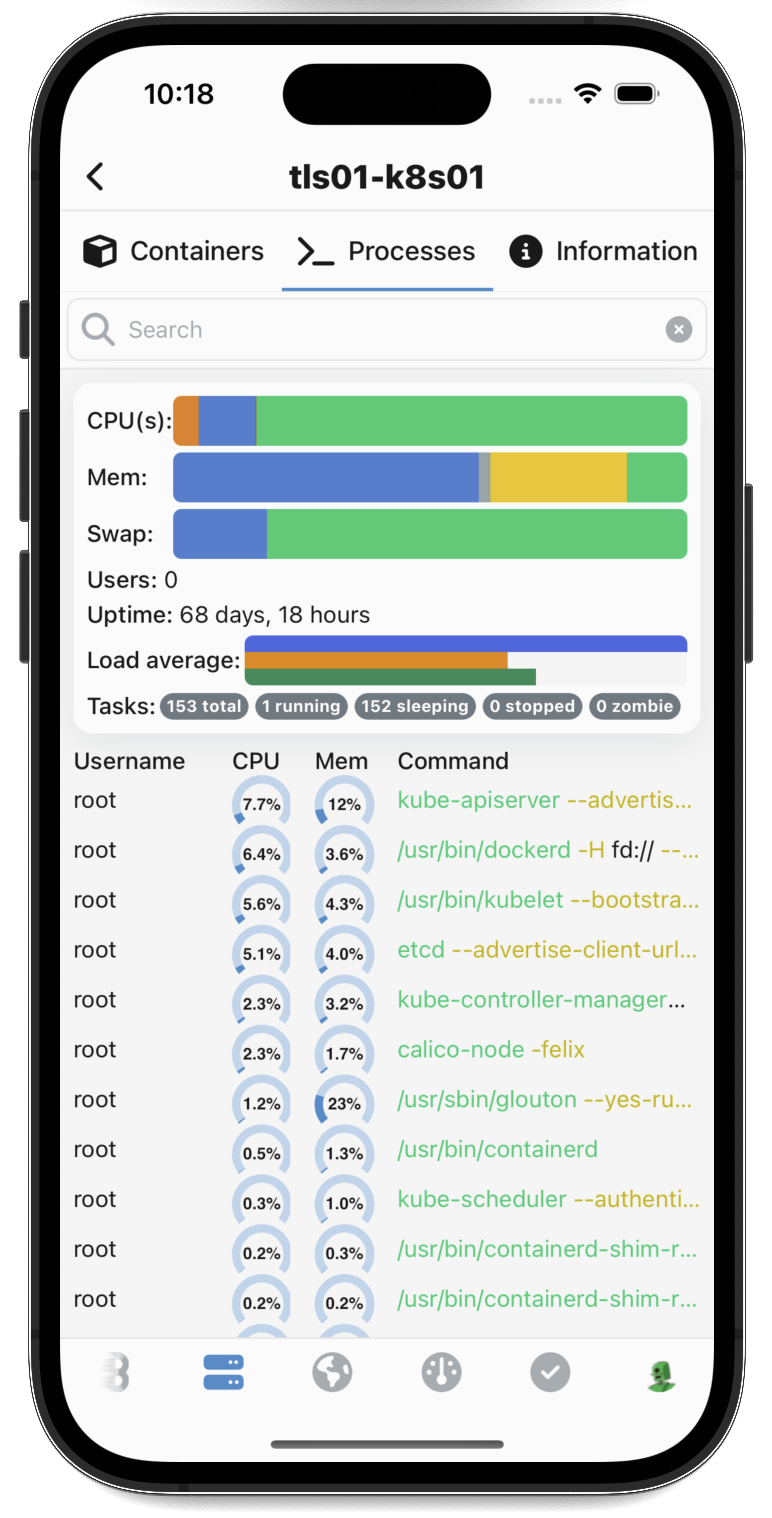
- See live process information in real time
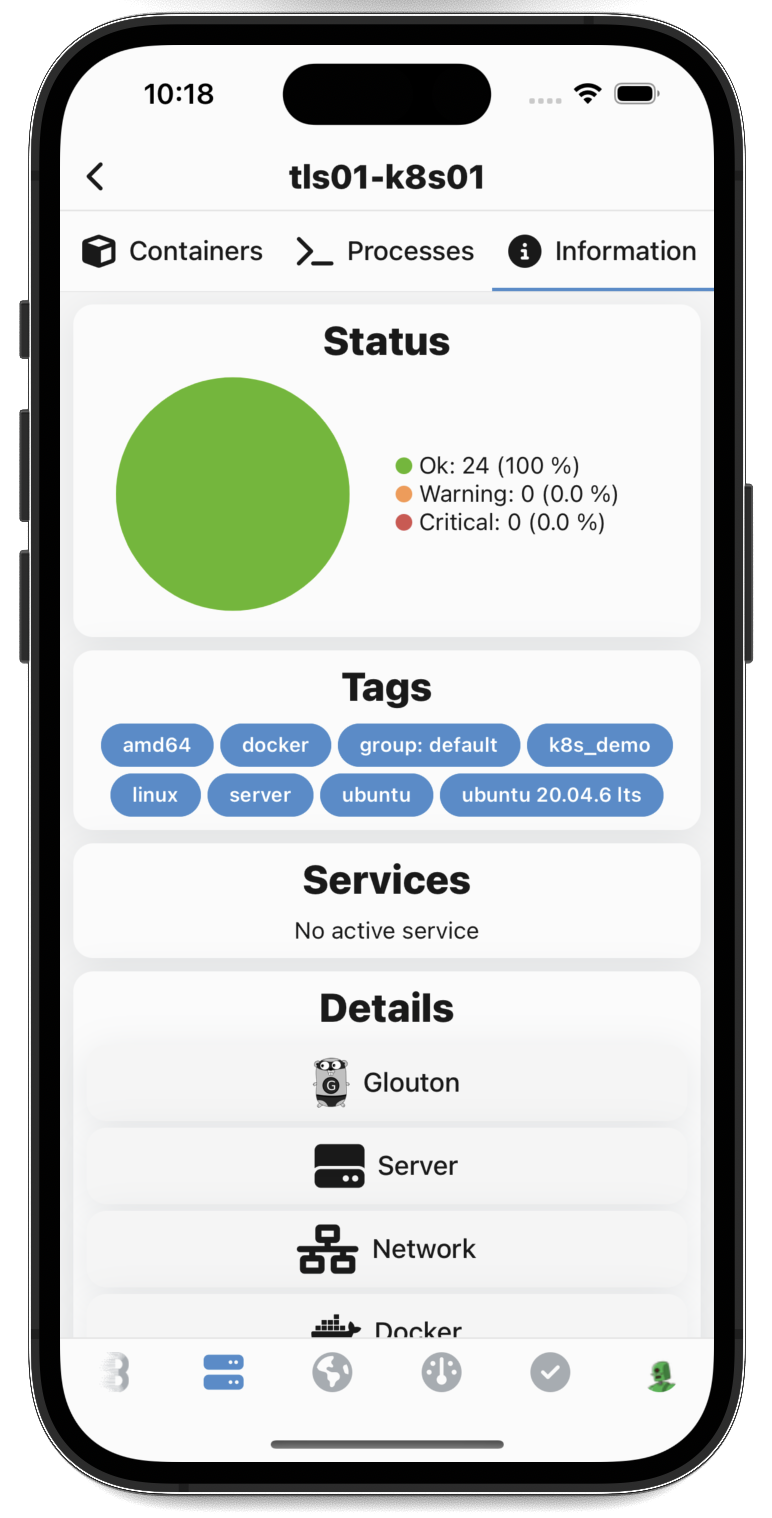
Detailed Server Metrics
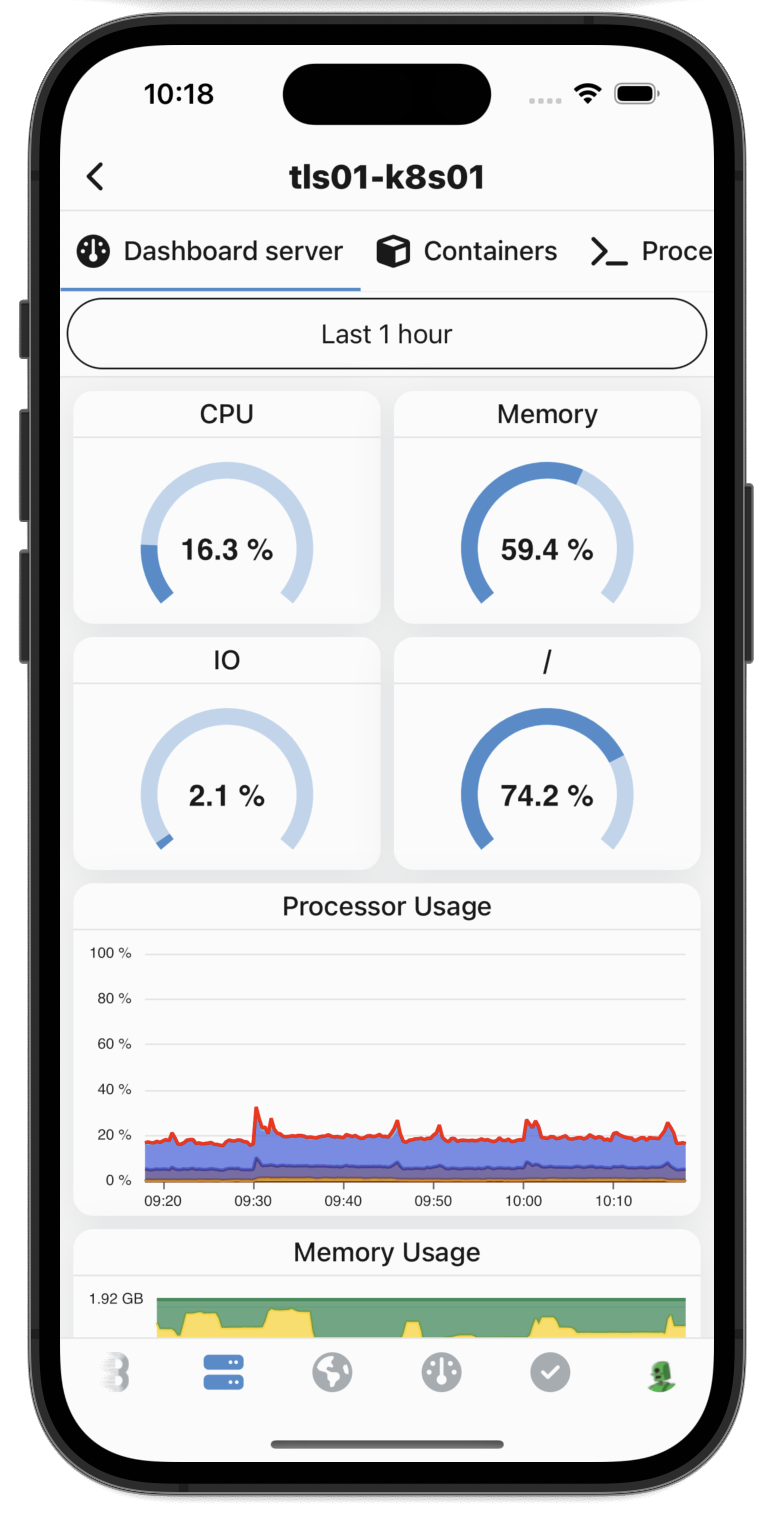
Section titled “Detailed Server Metrics”Swipe between different views to get comprehensive server information:
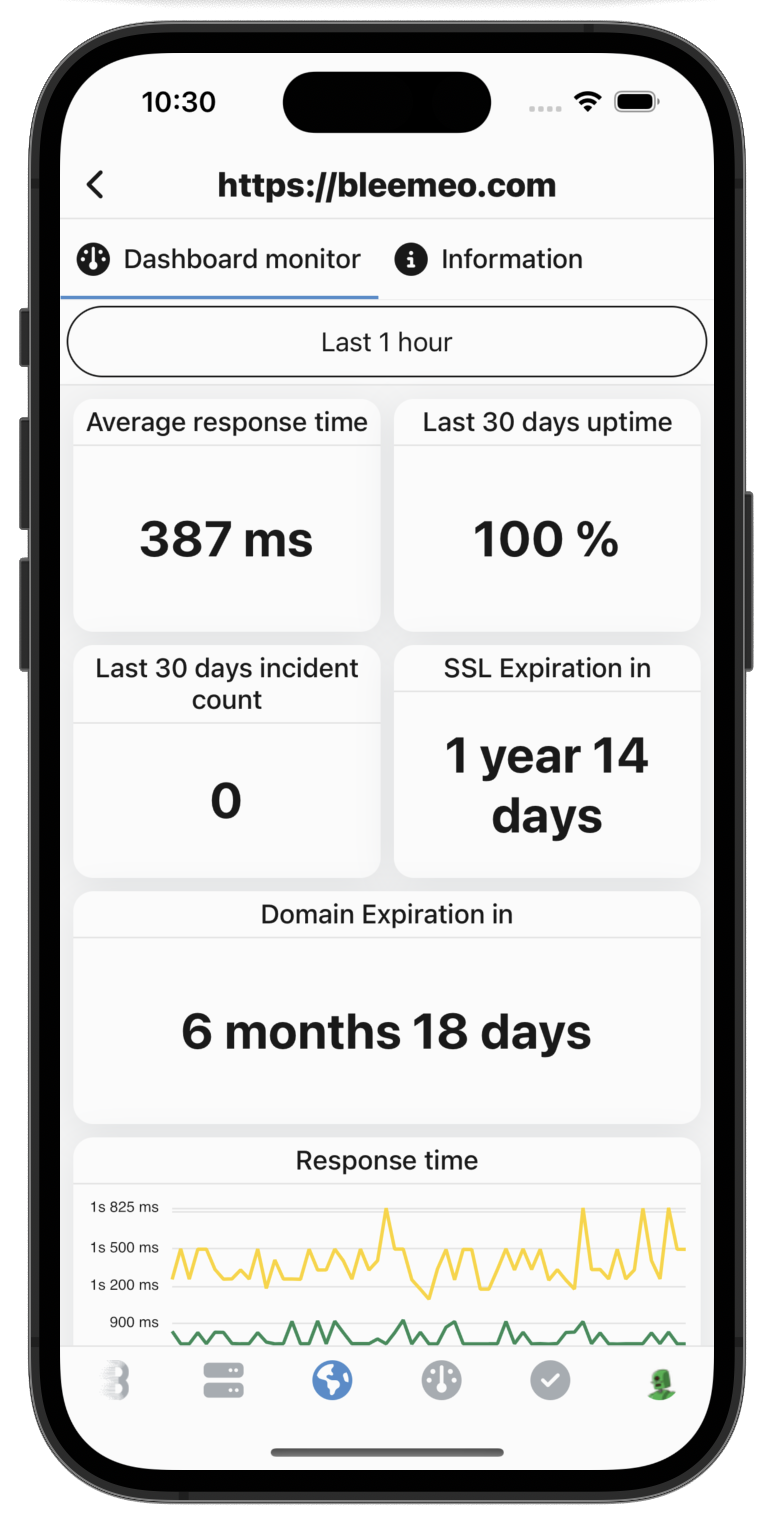
Custom Dashboards
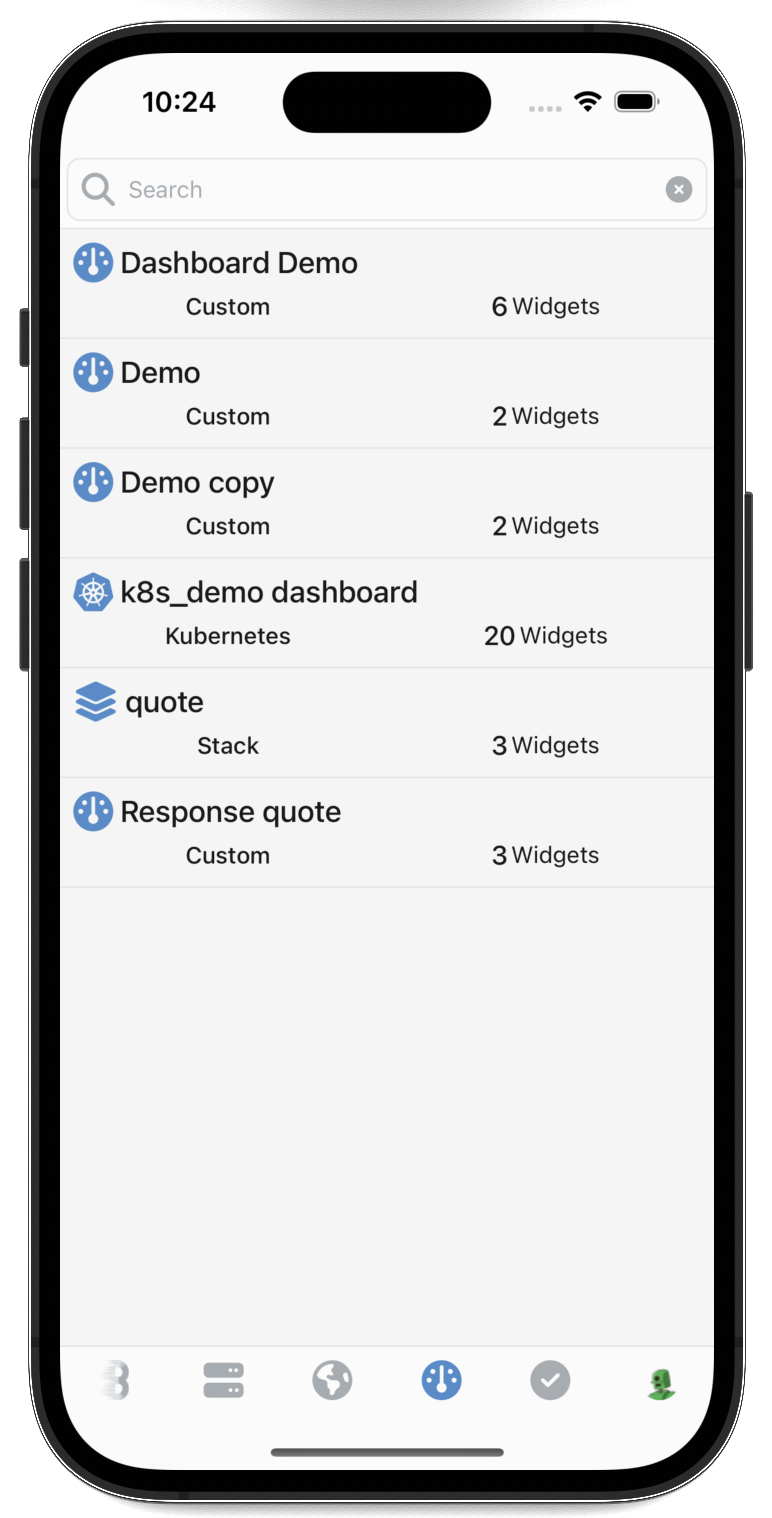
Section titled “Custom Dashboards”All dashboards created in the Bleemeo web panel are automatically available in the mobile app. This includes:
- Custom dashboards you’ve built to track specific metrics
- Auto-generated dashboards from container labels and annotations
- Tag-based dashboards grouped by your infrastructure tags
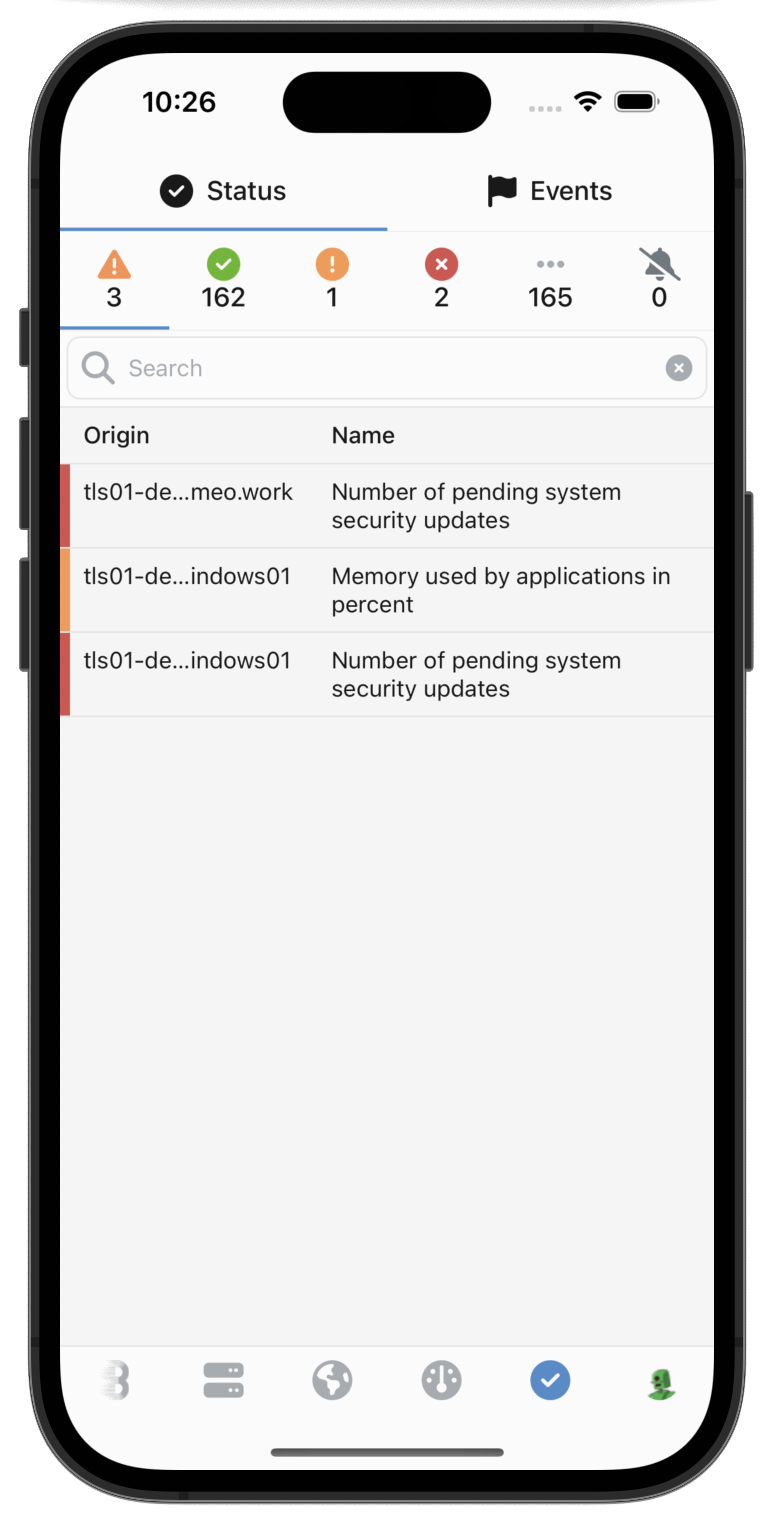
Status Center
Section titled “Status Center”The status view is your go-to place when you need to quickly assess what needs attention. It consolidates all issues across:
- Servers and system resources
- Services and applications
- Docker containers
- Uptime monitors
- Custom checks
When everything shows green, you know your infrastructure is healthy. When issues arise, you can immediately identify and investigate them.
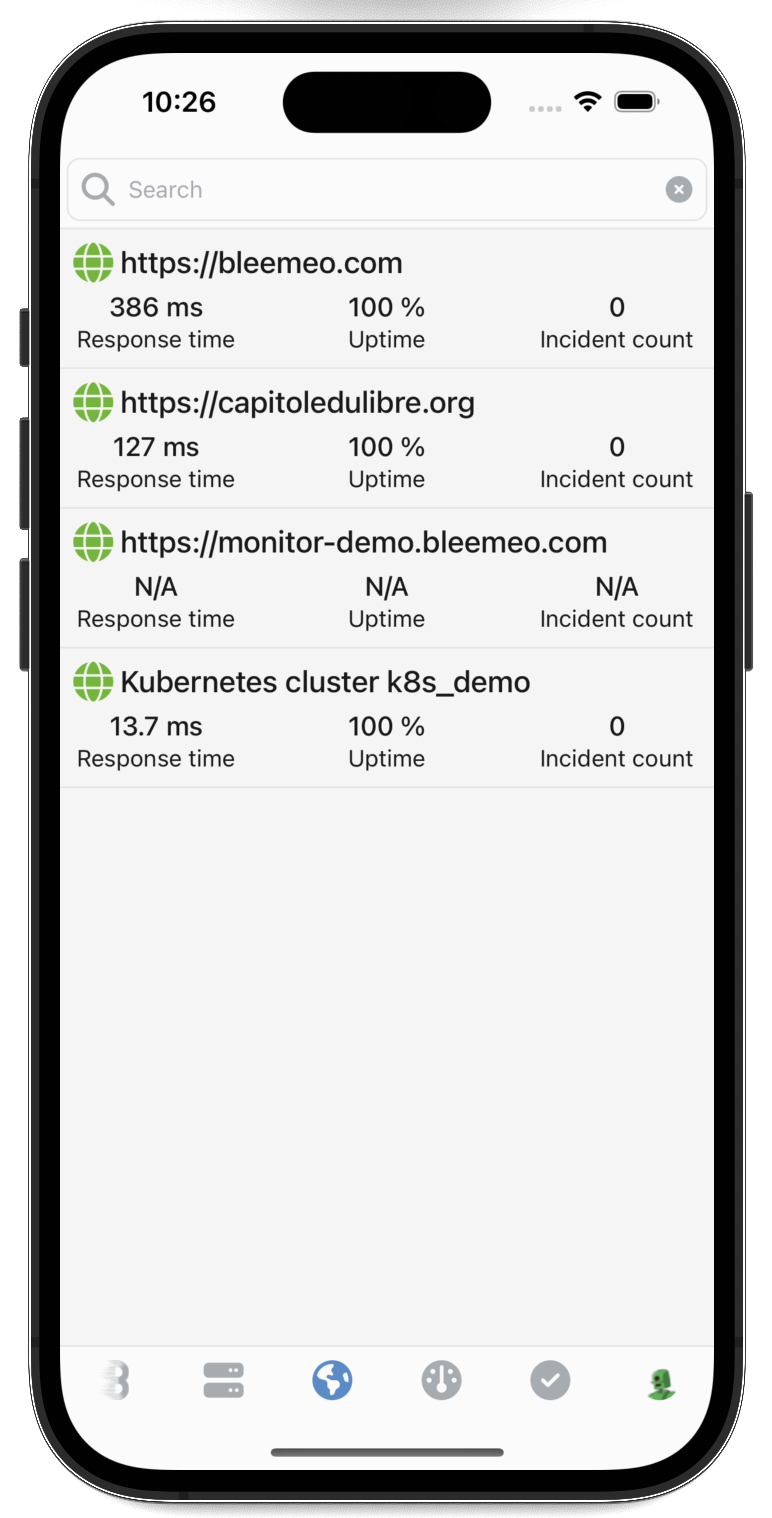
Uptime Monitors
Section titled “Uptime Monitors”Track the availability and performance of your external services with the monitors section:
- View uptime statistics for all your monitors
- Check response times from different probe locations
- Identify availability issues quickly
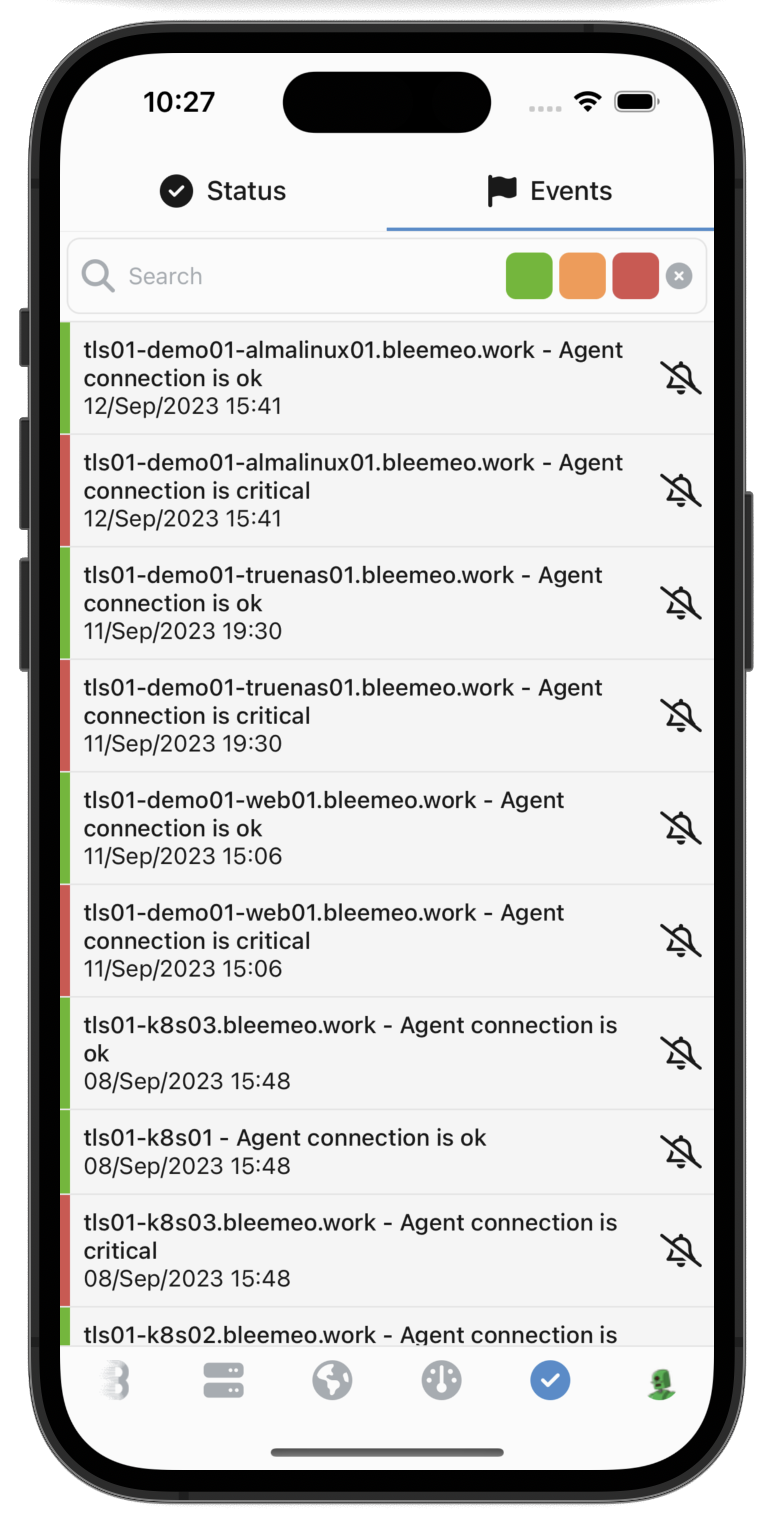
Event Timeline
Section titled “Event Timeline”The events section provides a complete history of everything that happened in your infrastructure. Use it to:
- Investigate incidents by checking what events occurred before an issue
- Search and filter events by type, severity, or time range
- Understand patterns in your infrastructure behavior
Get Started
Section titled “Get Started”Download the Bleemeo mobile app and sign in with your existing Bleemeo account credentials. All your infrastructure data will be immediately available.