

SquirrelDB with Prometheus and Dashglass
SquirrelDB is a Prometheus remote storage: Prometheus keeps scraping your targets and forwards every sample to SquirrelDB, which becomes the long term store. SquirrelDB also serves the Prometheus HTTP API, so a dashboard tool can query it directly, as if it were a Prometheus.
Connect Prometheus
Section titled “Connect Prometheus”Add a remote_write and a remote_read entry to your prometheus.yml:
remote_write:  - url: http://squirreldb:9201/api/v1/write
remote_read:  - url: http://squirreldb:9201/api/v1/read
remote_write sends every scraped sample to SquirrelDB. remote_read lets
Prometheus answer queries from SquirrelDB for the data it no longer has locally,
so history survives a Prometheus restart or a recreated Prometheus volume.
While you are there, it is worth scraping SquirrelDB itself: it exposes its
internal metrics on /metrics.
scrape_configs: - job_name: 'squirreldb' static_configs: - targets: ['squirreldb:9201']A complete example is available in the SquirrelDB repository.
Multi-tenancy
Section titled “Multi-tenancy”If you use multi-tenancy, the tenant is carried by an HTTP header, which Prometheus can add to both directions:
remote_write:  - url: http://squirreldb:9201/api/v1/write    headers:      X-SquirrelDB-Tenant: tenant1
remote_read:  - url: http://squirreldb:9201/api/v1/read    headers:      X-SquirrelDB-Tenant: tenant1
The same mechanism carries the other
request headers, such as
X-SquirrelDB-TTL to give the points written by this Prometheus a specific
retention.
Build dashboards
Section titled “Build dashboards”SquirrelDB embeds the Prometheus HTTP API v1, so any tool that speaks to a
Prometheus can query it directly. The endpoints it serves under /api/v1/ are the
read side of that API: query, query_range, series, labels,
label/<name>/values, plus read and write for remote storage.
Dashglass
Section titled “Dashglass”Dashglass is Bleemeo’s Open Source dashboard tool, and the one we recommend alongside SquirrelDB. It is the dashboard part of Grafana and nothing else: a single small Go binary, no database, and every dashboard is a git-friendly file, so you can edit in the UI and review the diff in git.
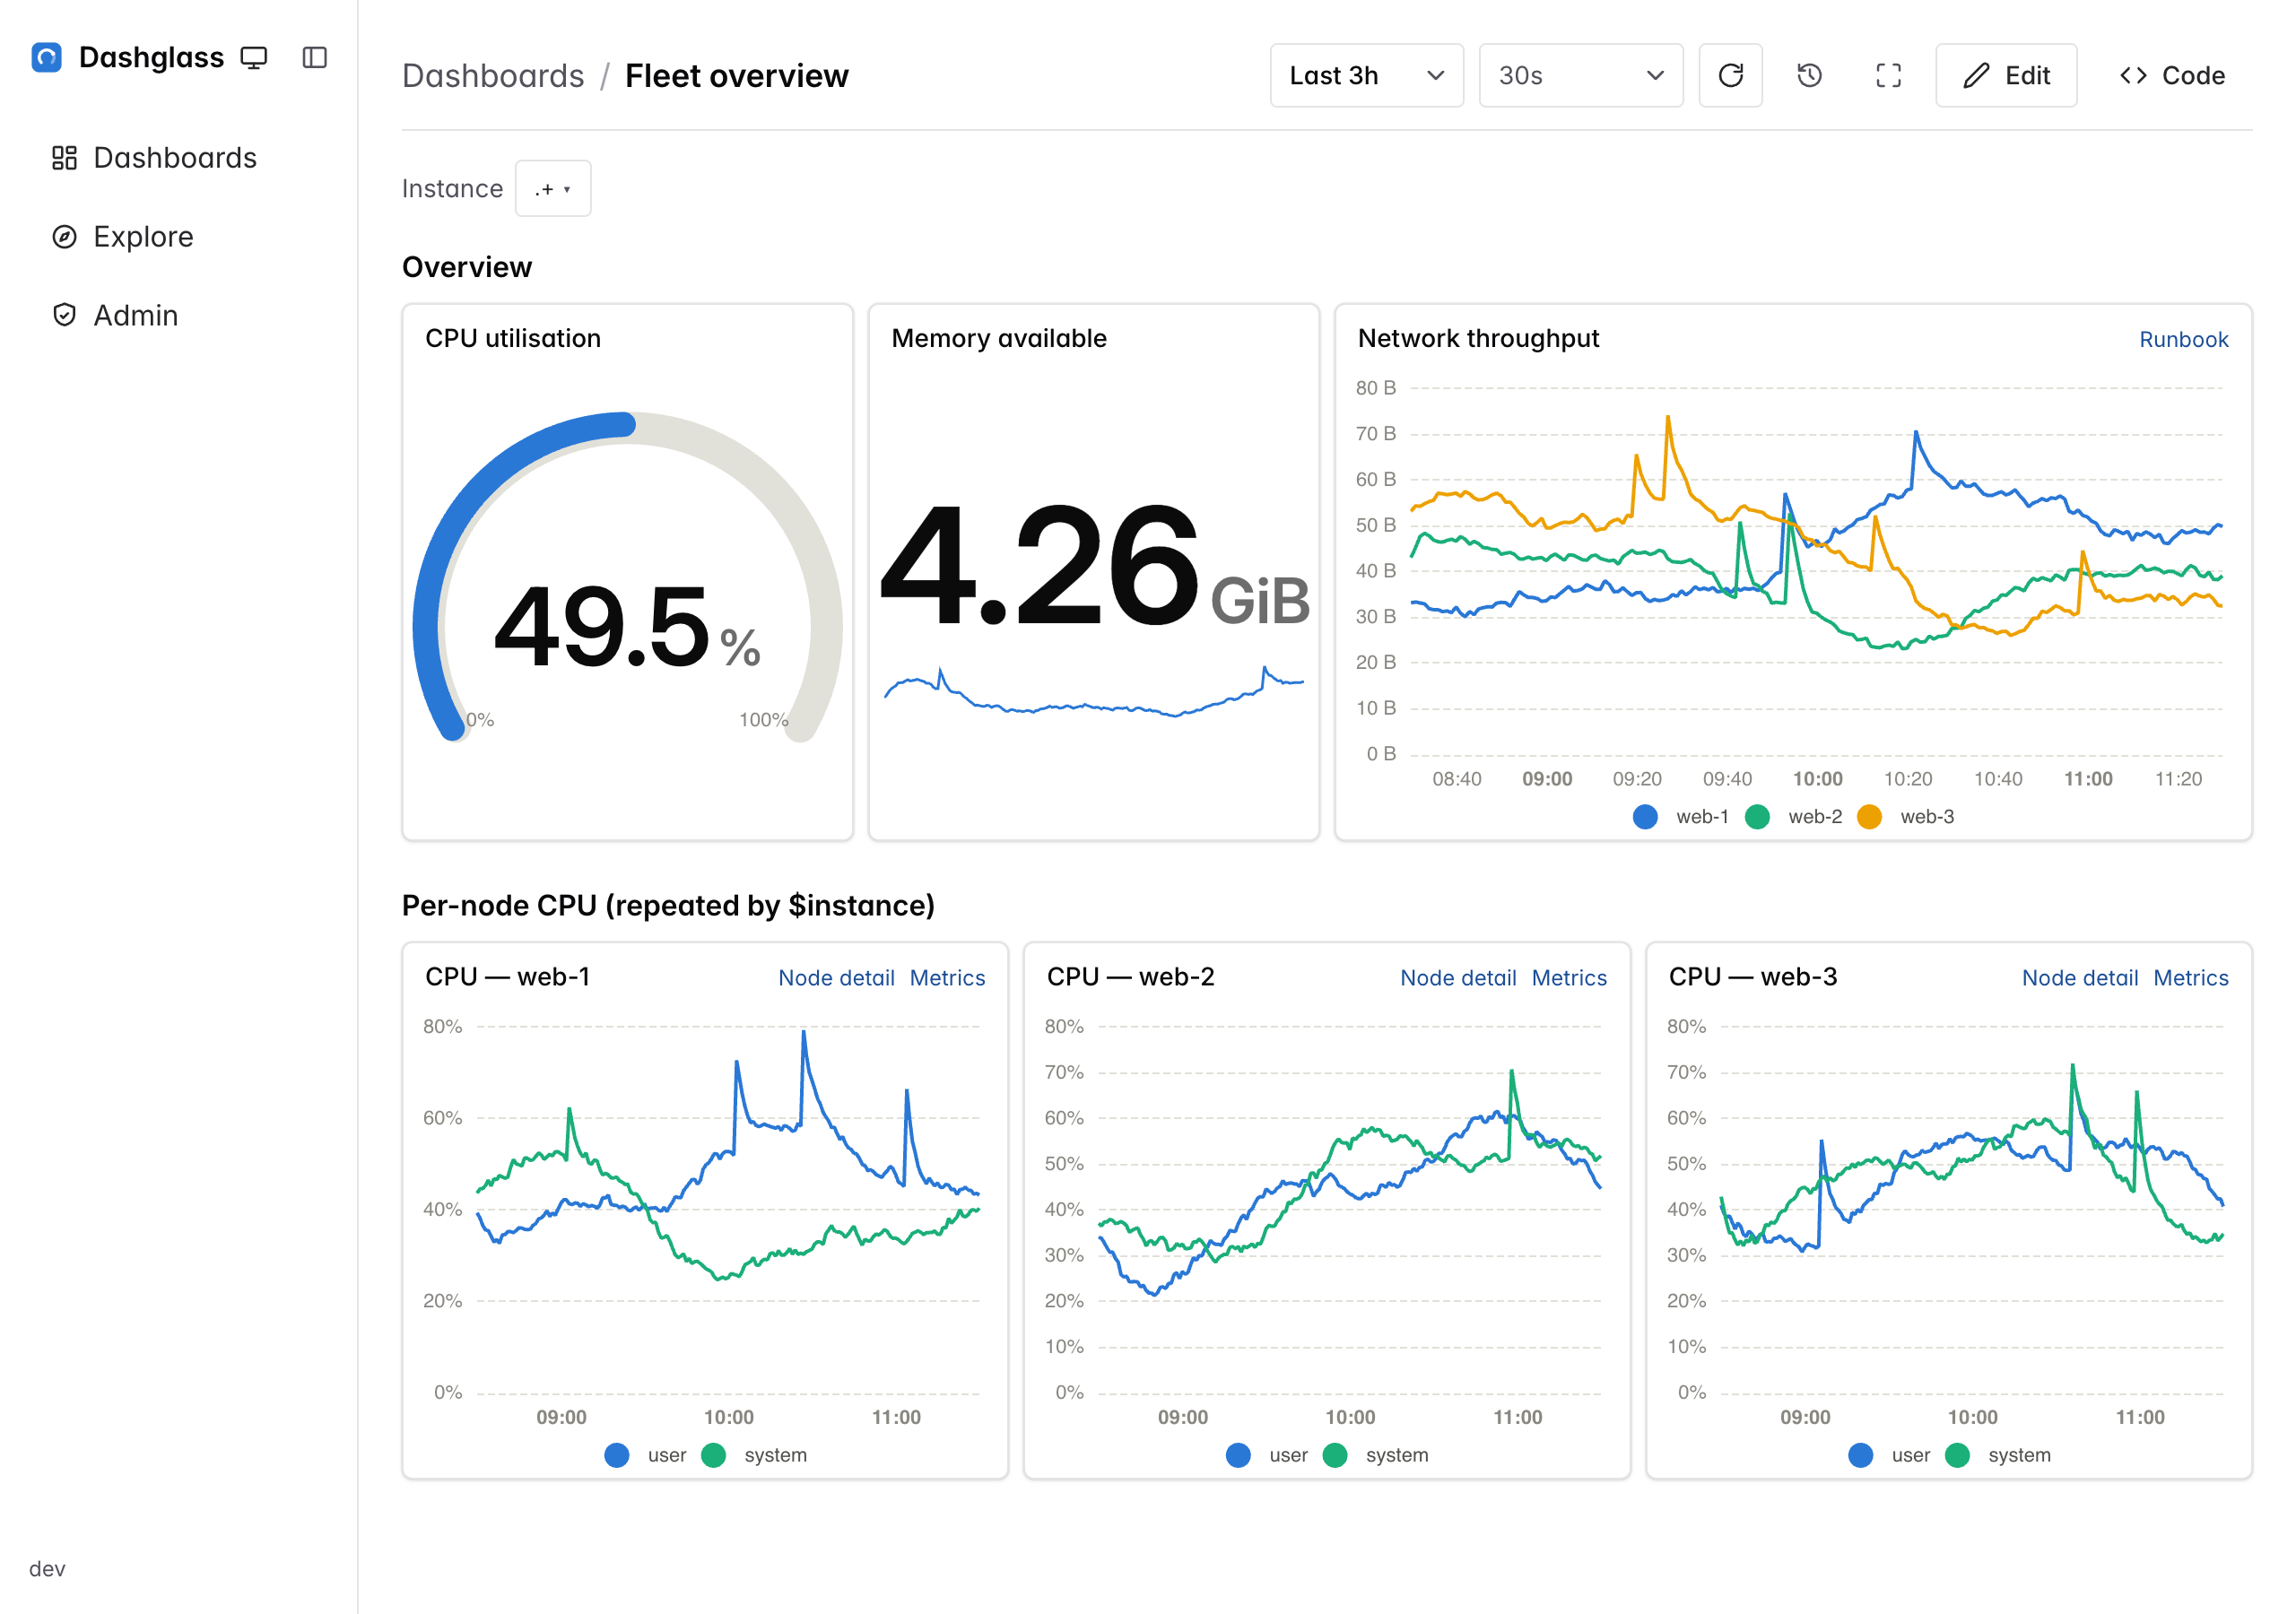
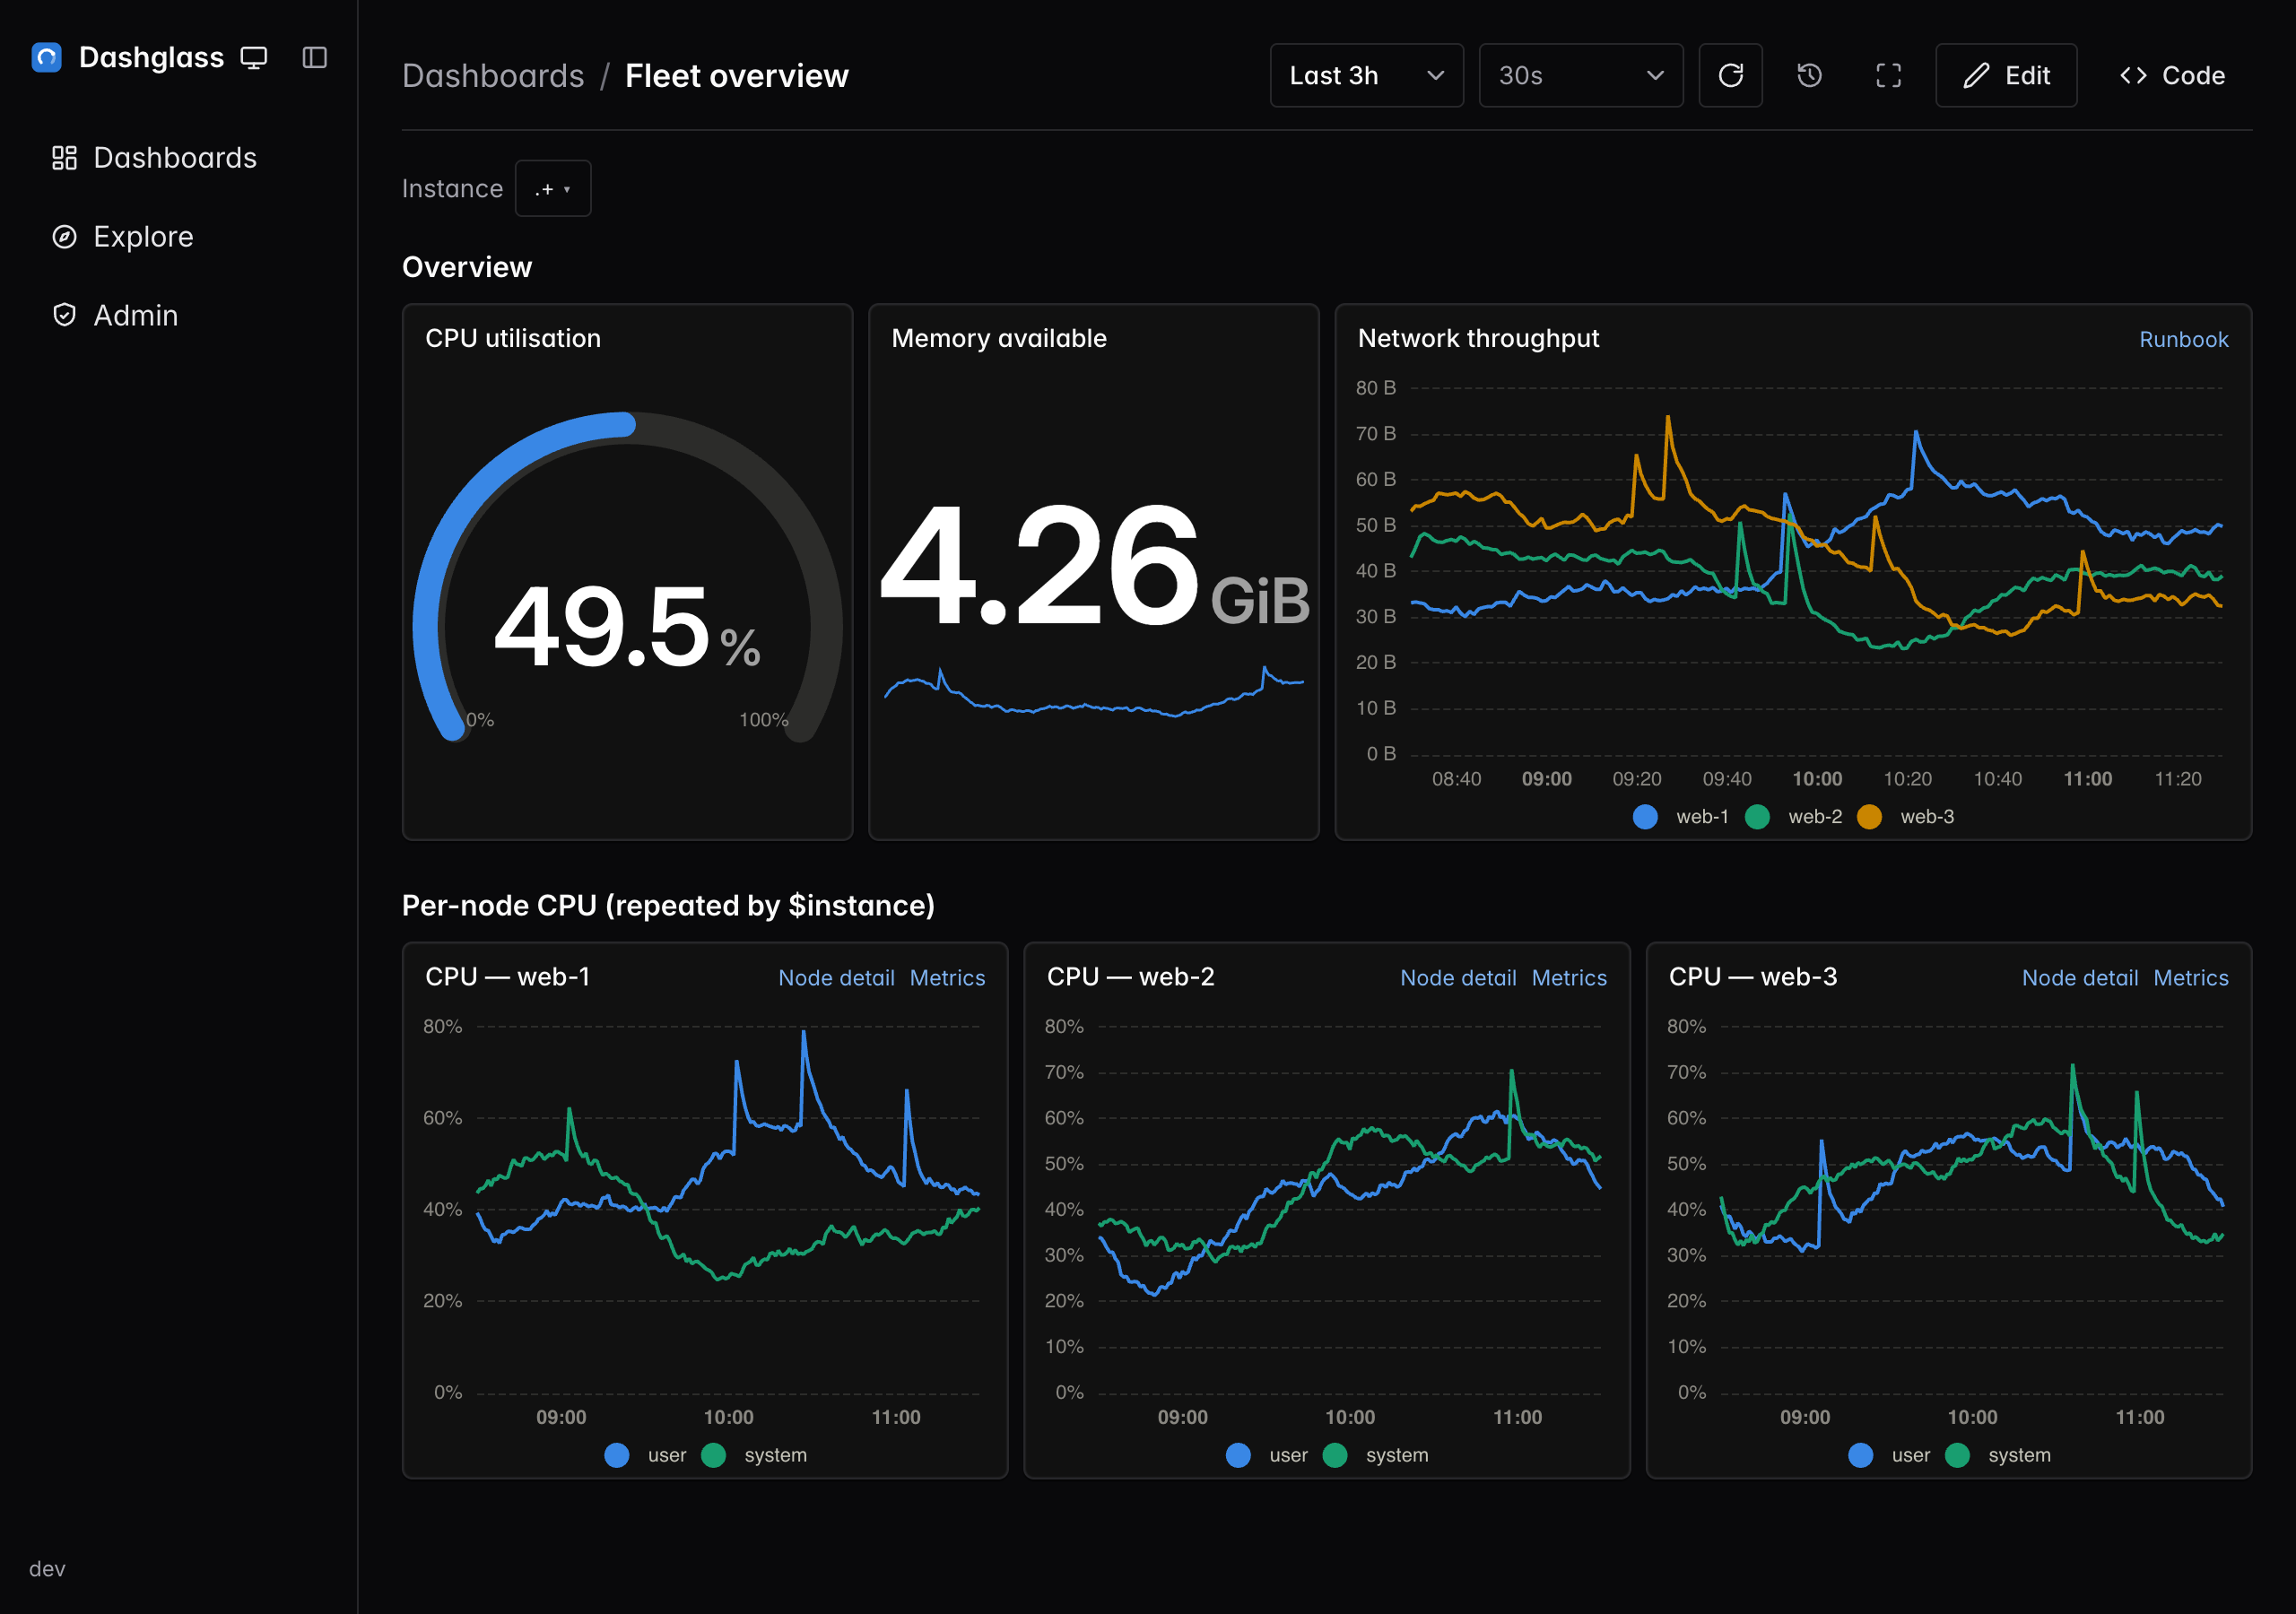
It queries the native Prometheus API paths, which is exactly what SquirrelDB serves, so you point it straight at SquirrelDB — no Prometheus in the query path:
docker run -p 8080:8080 -v "$(pwd)/dashboards:/dashboards" \ ghcr.io/bleemeo/dashglass -prometheus-url http://squirreldb:9201Then open http://localhost:8080. Prebuilt binaries are attached to each
release if you prefer:
./dashglass -prometheus-url http://squirreldb:9201 -dashboards-dir ./dashboardsComing from Grafana, Dashglass imports dashboards from a JSON export or straight from grafana.com, with per-panel warnings for what it could not convert.
If you use multi-tenancy, Dashglass sends
arbitrary headers upstream. In dashglass.yaml:
prometheus: url: http://squirreldb:9201 headers: X-SquirrelDB-Tenant: tenant1For dashboards managed exclusively by git, run it with -readonly: the API then
refuses every write, whatever the role of the user.
Grafana
Section titled “Grafana”Grafana works too, and there are two ways to plug it in — they are not exclusive.
Directly on SquirrelDB. Create a Grafana Prometheus datasource with
http://squirreldb:9201 as its URL. This queries the long term store without going
through Prometheus, which is what you want when several Prometheus instances write
to the same SquirrelDB, or when Prometheus is not the only writer. It is the setup
used by the highly available example.
Through Prometheus. Point the datasource at your Prometheus, as usual. Thanks
to remote_read, queries that reach beyond its local retention are served from
SquirrelDB transparently. This is what the
quickstart Docker compose
does.
Alerting and recording rules
Section titled “Alerting and recording rules”SquirrelDB stores and serves points; it does not evaluate rules. Keep your alerting and recording rules in Prometheus, which evaluates them against its local data and writes the result to SquirrelDB like any other sample.
Checking it works
Section titled “Checking it works”curl http://squirreldb:9201/readyanswersReadyonce SquirrelDB is up.- On the Prometheus side, the
prometheus_remote_storage_*metrics report what is being shipped, and its own web interface shows the remote write queue. - On the SquirrelDB side,
squirreldb_tsdb_ingested_points_totalgrows as points arrive, whichever backend you use. - Recreating Prometheus without its volume, then querying an old range from your dashboards, is the end-to-end proof that the data really comes from SquirrelDB.