Mobile Application
Bleemeo offers a Mobile application to track your infrastructure from everywhere. All views you have on the Cloud Interface are also available from the mobile application. To configure something you need to access the Cloud Interface. The mobile application also delivers notifications.
The Bleemeo mobile application is available on the stores:

![]()
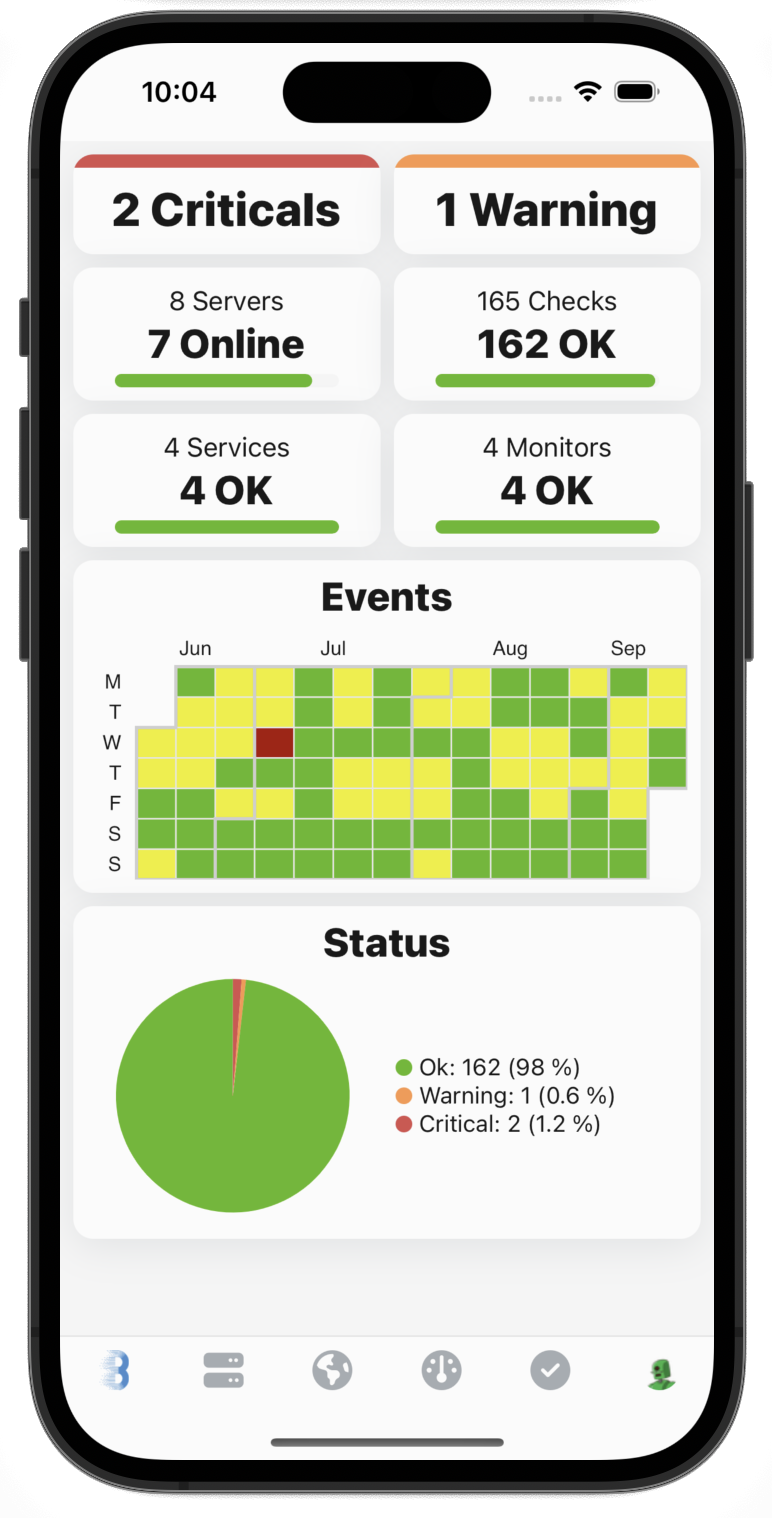
The application home page provides a Heatmap of the infrastructure events and KPI of the infrastructure: how many services are monitored (and their status), how many servers are monitored (and their status), status distribution. This is the place to start with to have an overview of the health of the monitored infrastructure.
At any moment, each section of the application is accessible with the bottom navigation bar.
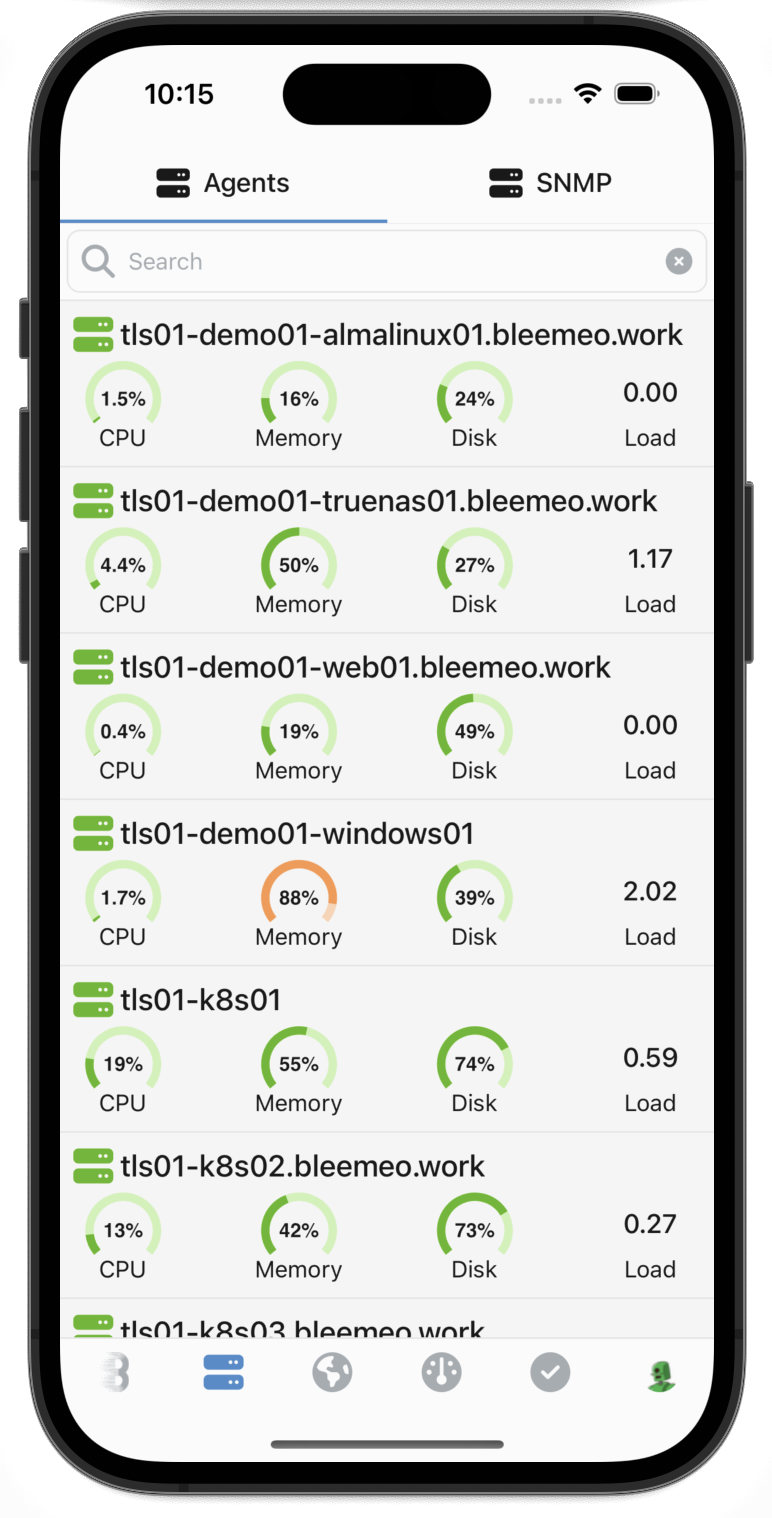
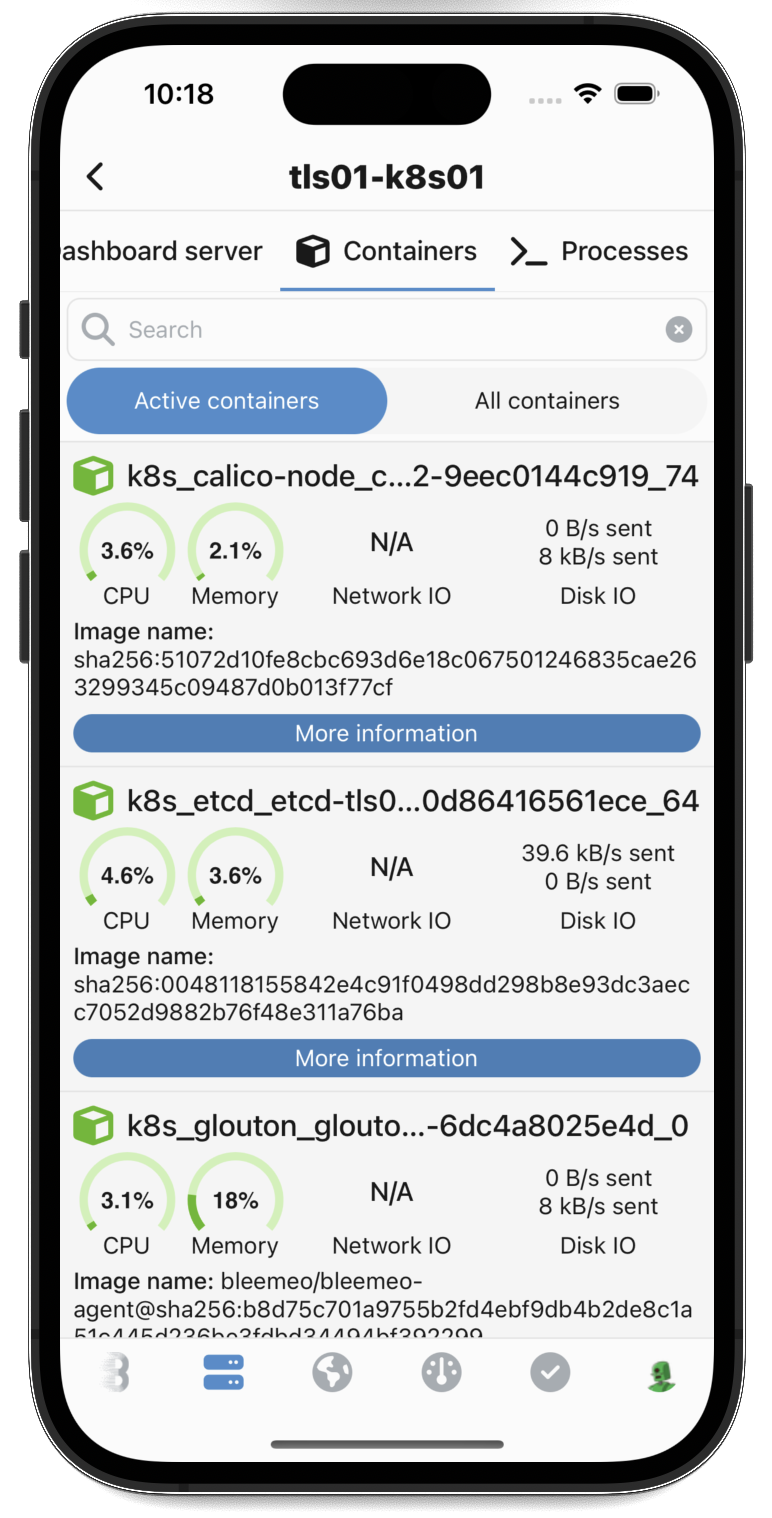
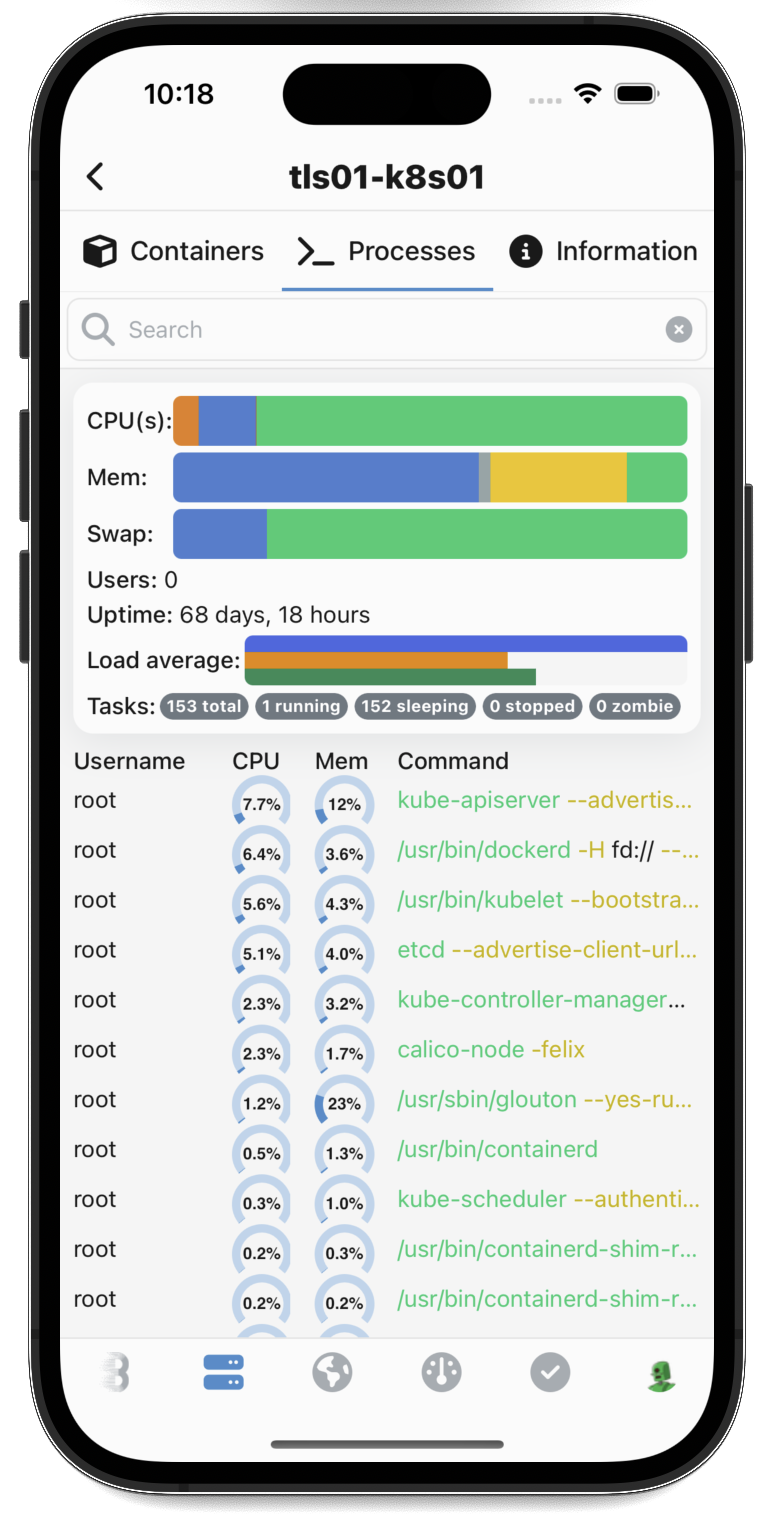
The first section allows seeing each server of your infrastructure, the server default dashboard, all containers, and a live process view of what's running on the server. If you get alerted on the server, you can check all health details on this server within this section.
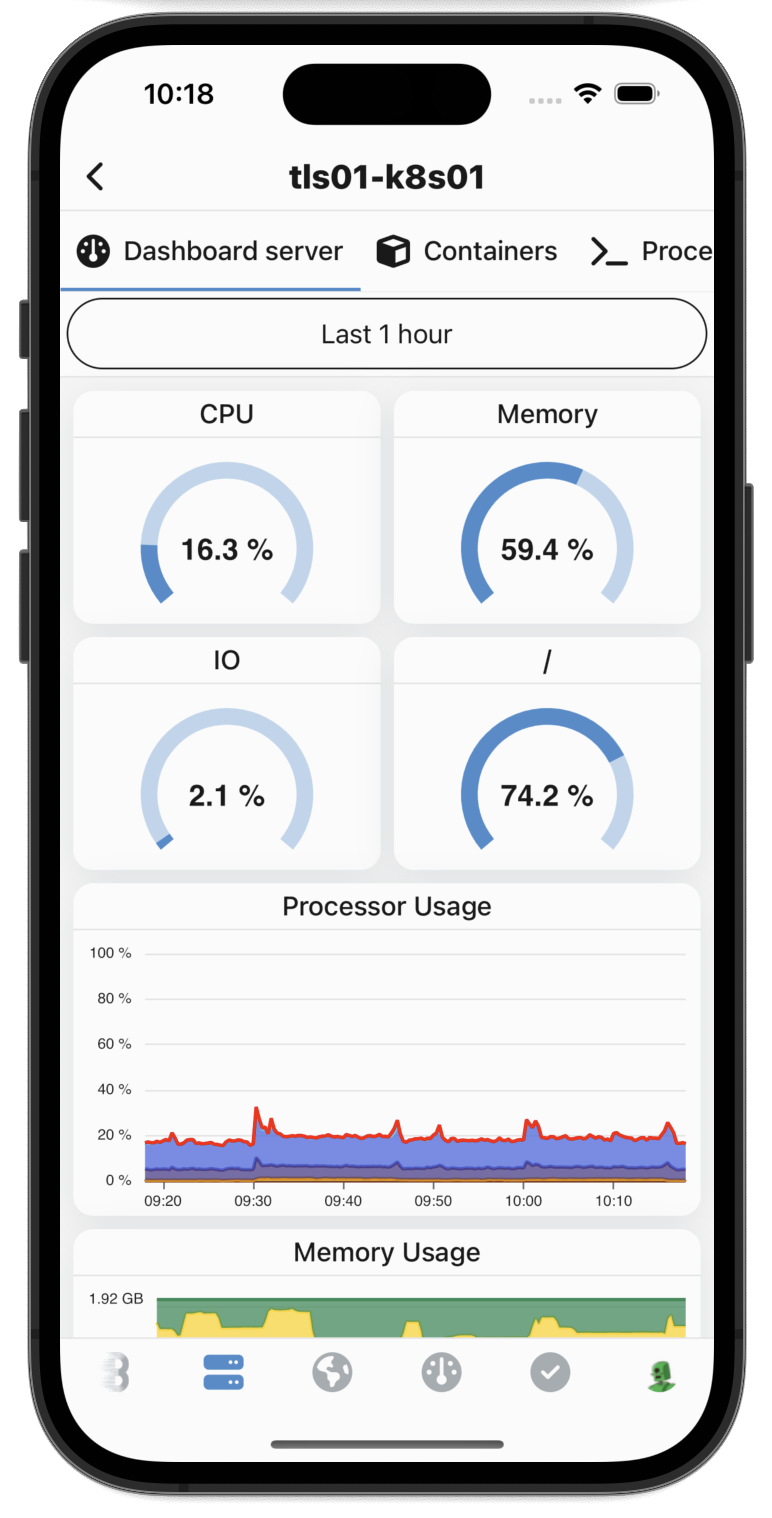
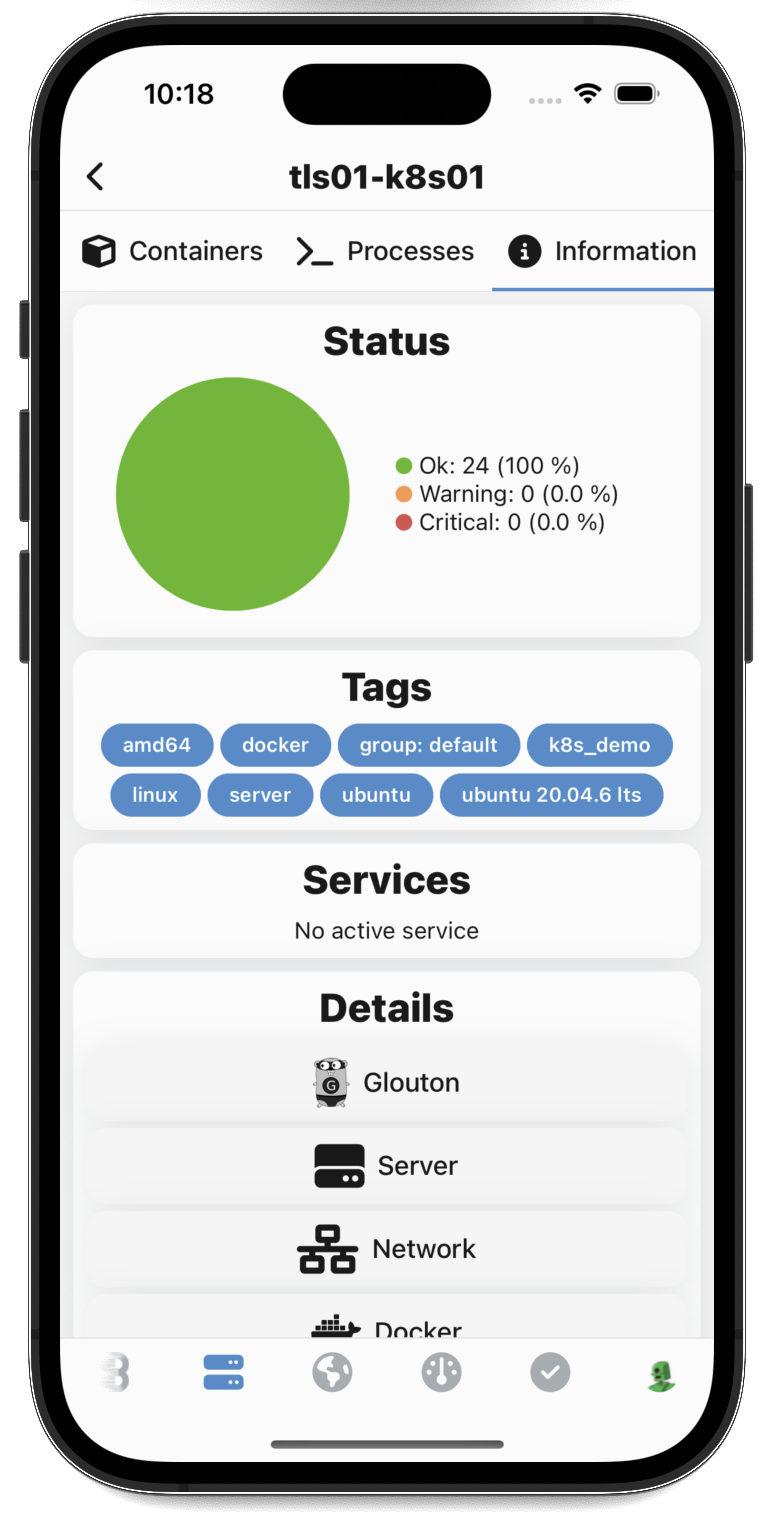
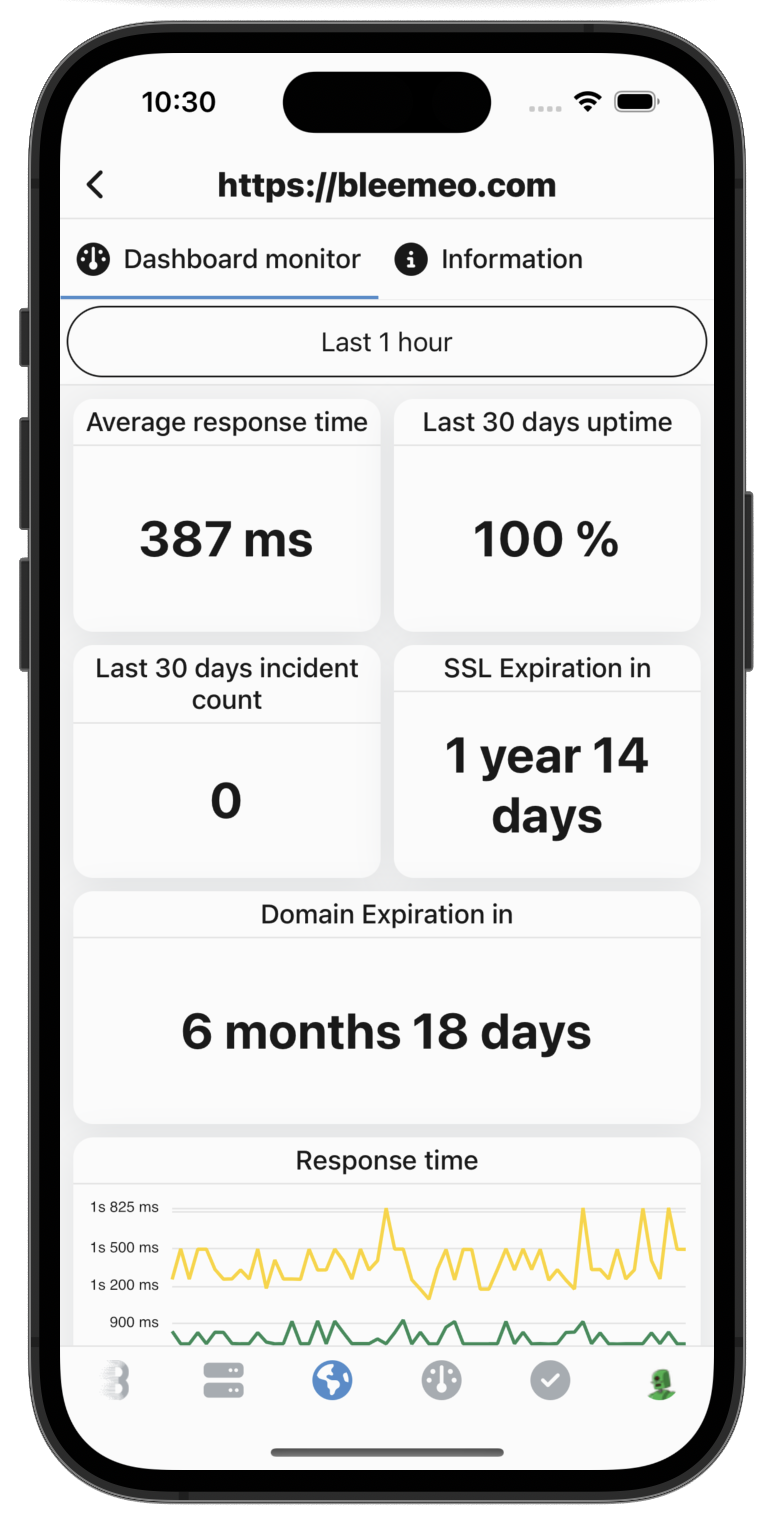
For more intuitiveness you can slide between your dashboards with all server key metrics (CPU, RAM, Disk, network), Docker containers view (with statistics and docker information), live processes monitoring, and information.
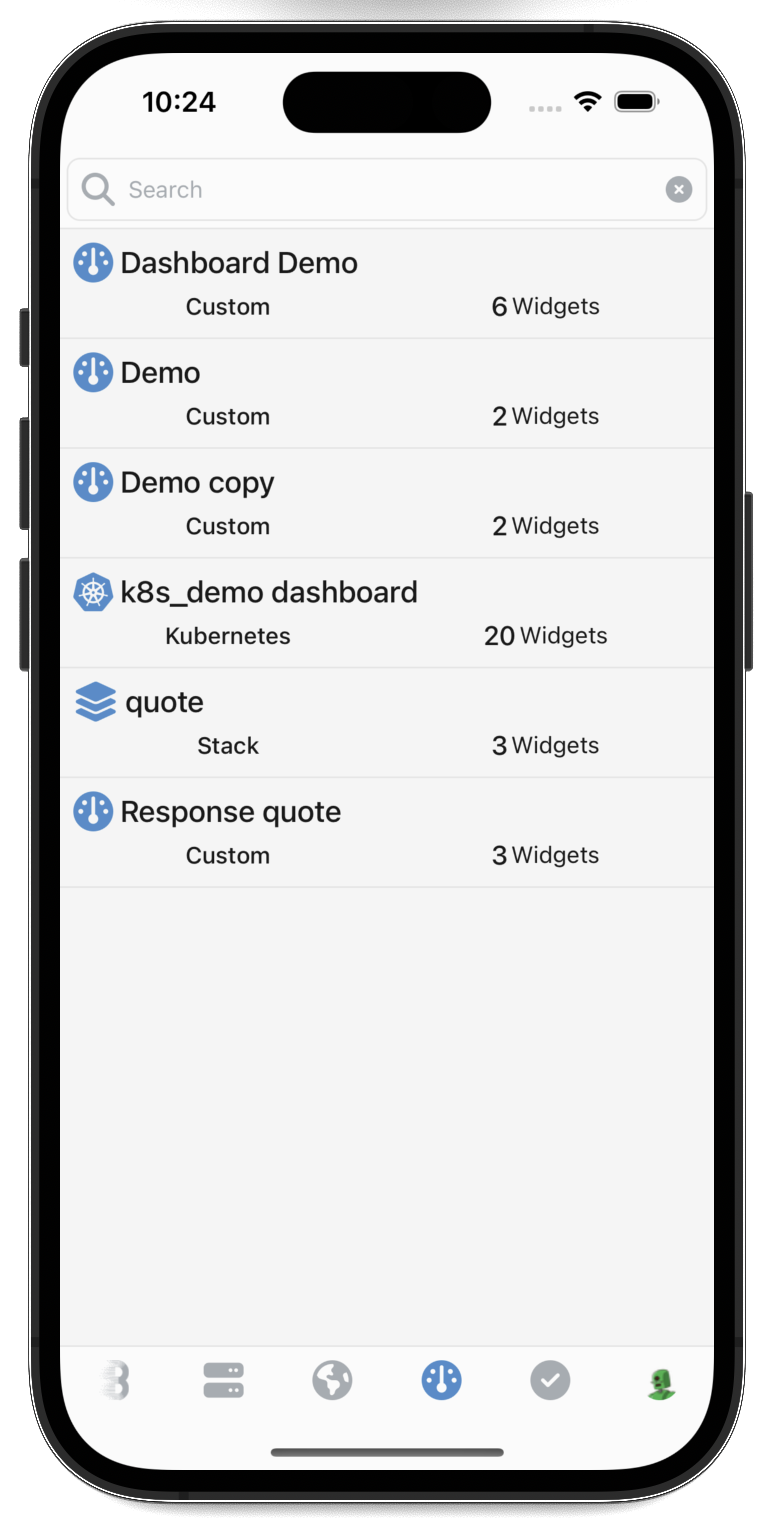
The Dashboards section contains all the custom dashboards you have created from the Bleemeo panel or any Dashboard you could have created using labels/annotations on your containers and/or tags on the machine. This allows you to get on your mobile all the business information related to your infrastructure. With all those tabs combined, you can get a complete view of your server's health wherever you are.
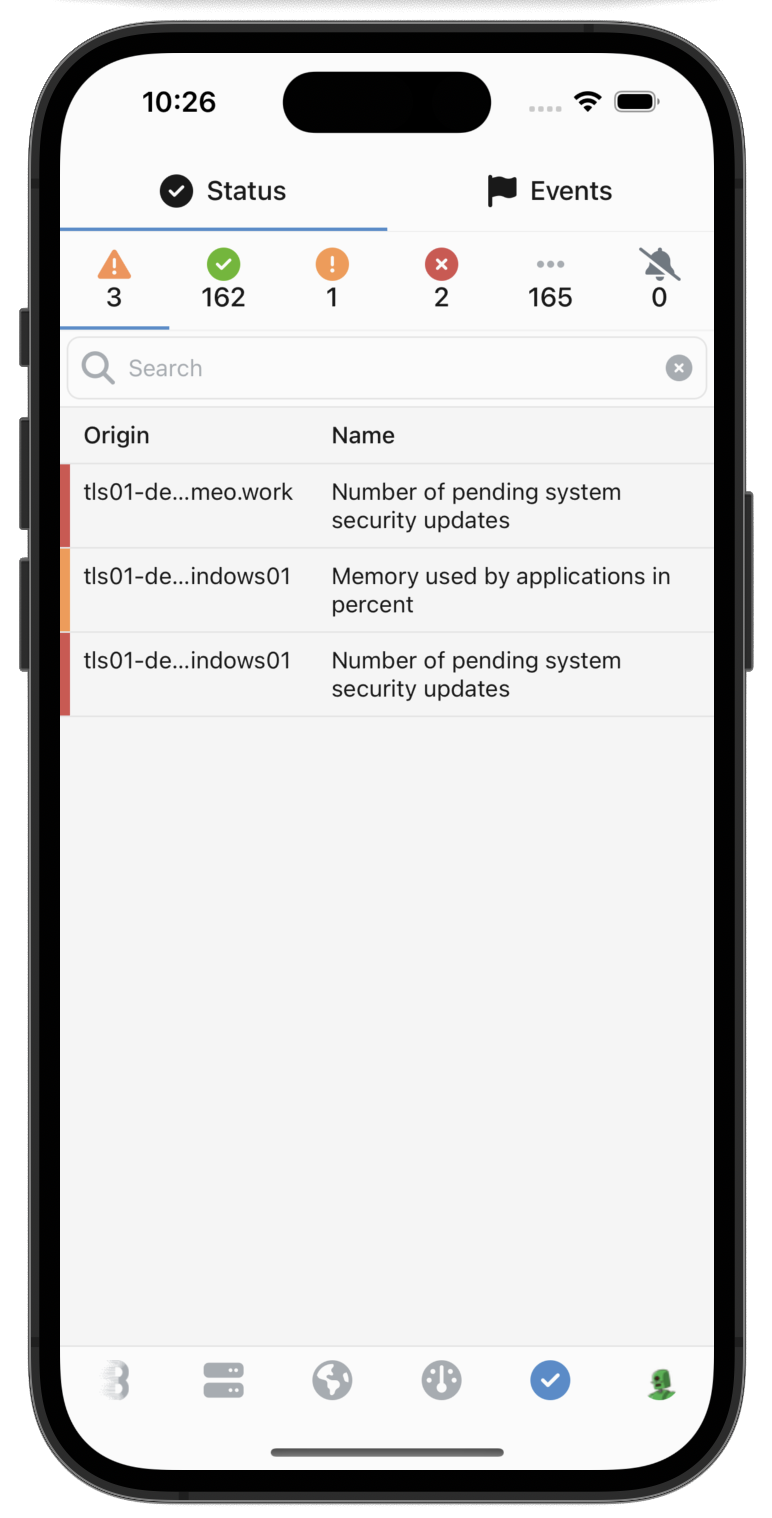
The status section offers a view of all issues of your infrastructure. This is the best starting point to see what's going on in your infrastructure. If everything is green you're good and can go back to real life 😎. If that's not the case, you get an immediate view of the issues and the previous servers section allows you to dig more on the current issues. This section covers servers, monitors, containers, applications, custom checks issues. One place for all issues.
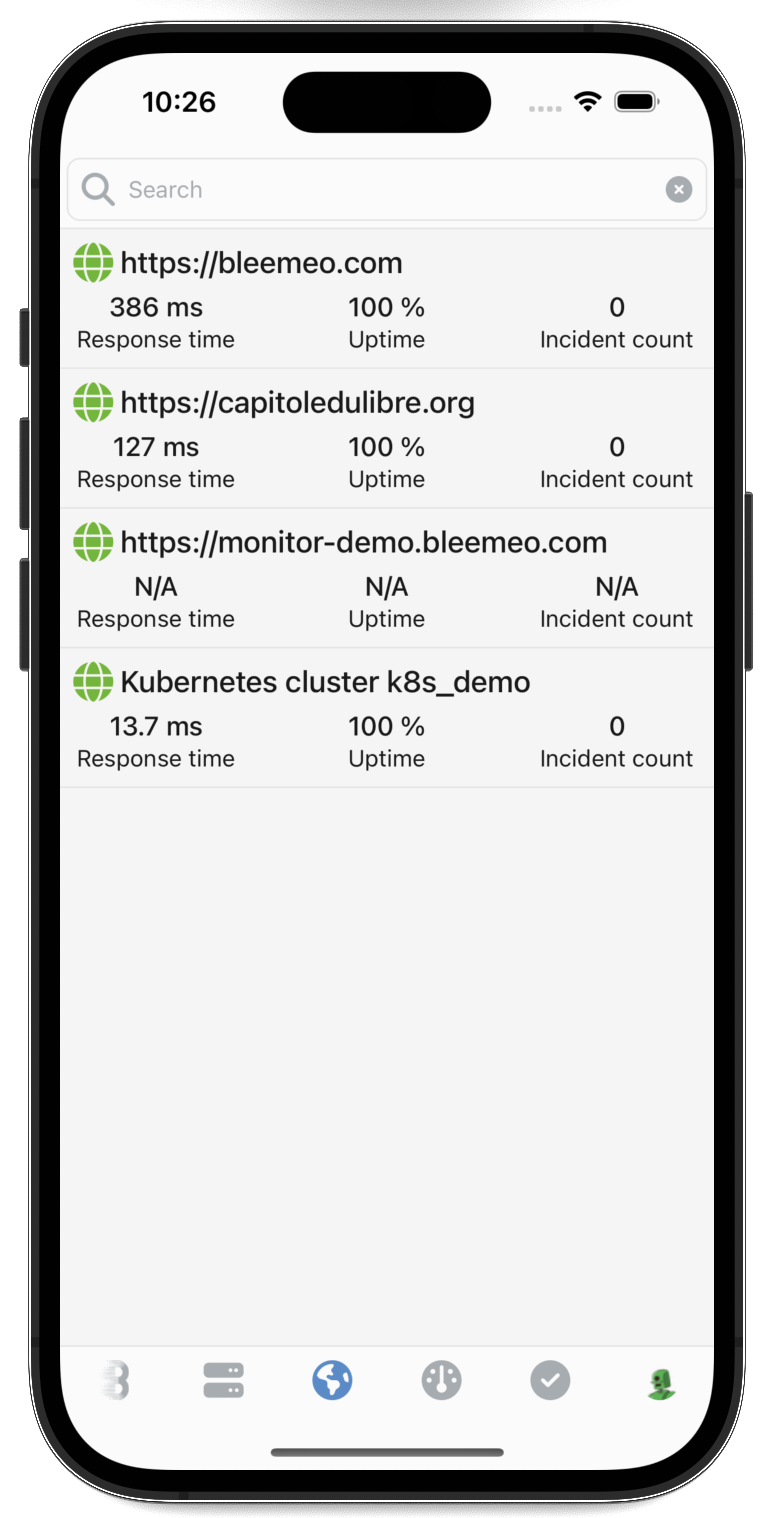
The monitors section is a view of all your monitors defined on the Bleemeo panel. Monitors and probes distributed around the world to check your service. Here you have uptime statistics and response time for all defined services.
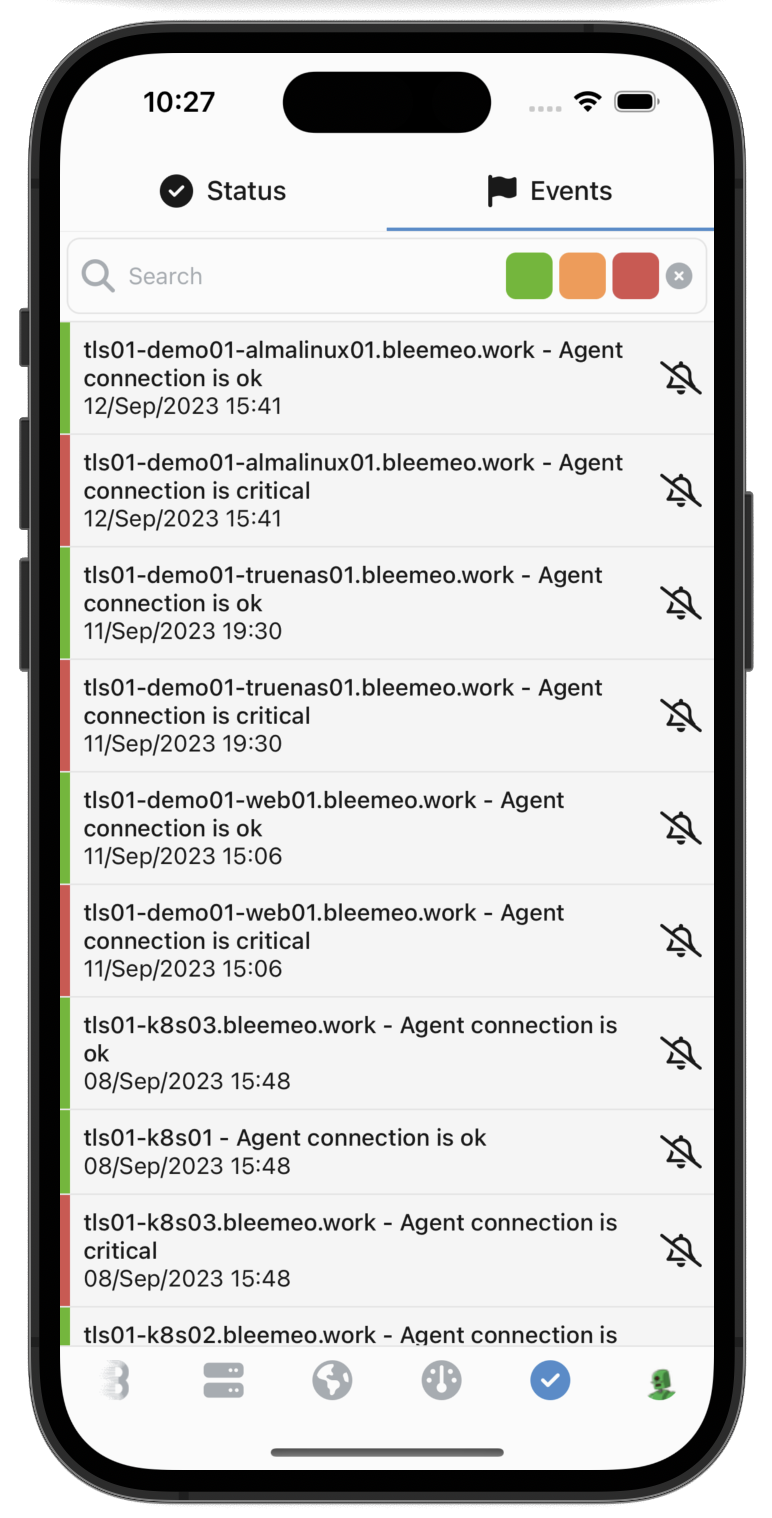
The events section is the record of all events that happened on your infrastructure. The status section is the current status, but if you want to check what happened some minutes/hours/days ago, this is the right place to find the information. You can search and get details of all past events.