Application Monitoring Overview
Application Monitoring lets you view the health of a cluster, with multiple services shown on one graph. New services are automatically added to the graph and removed when the service is removed.
Create / Edit Application
Section titled “Create / Edit Application”You can create an application from the Applications tab on the left of the panel, by clicking on the +.
All you have to do is give your application a name and a tag. The tag can be an existing one (in which case all the services or monitors that have this tag will be added automatically), or a new tag that you can then add to your various services or monitors.
Once the application has been created, you have several ways of adding or removing a service or monitor:
From the web interface
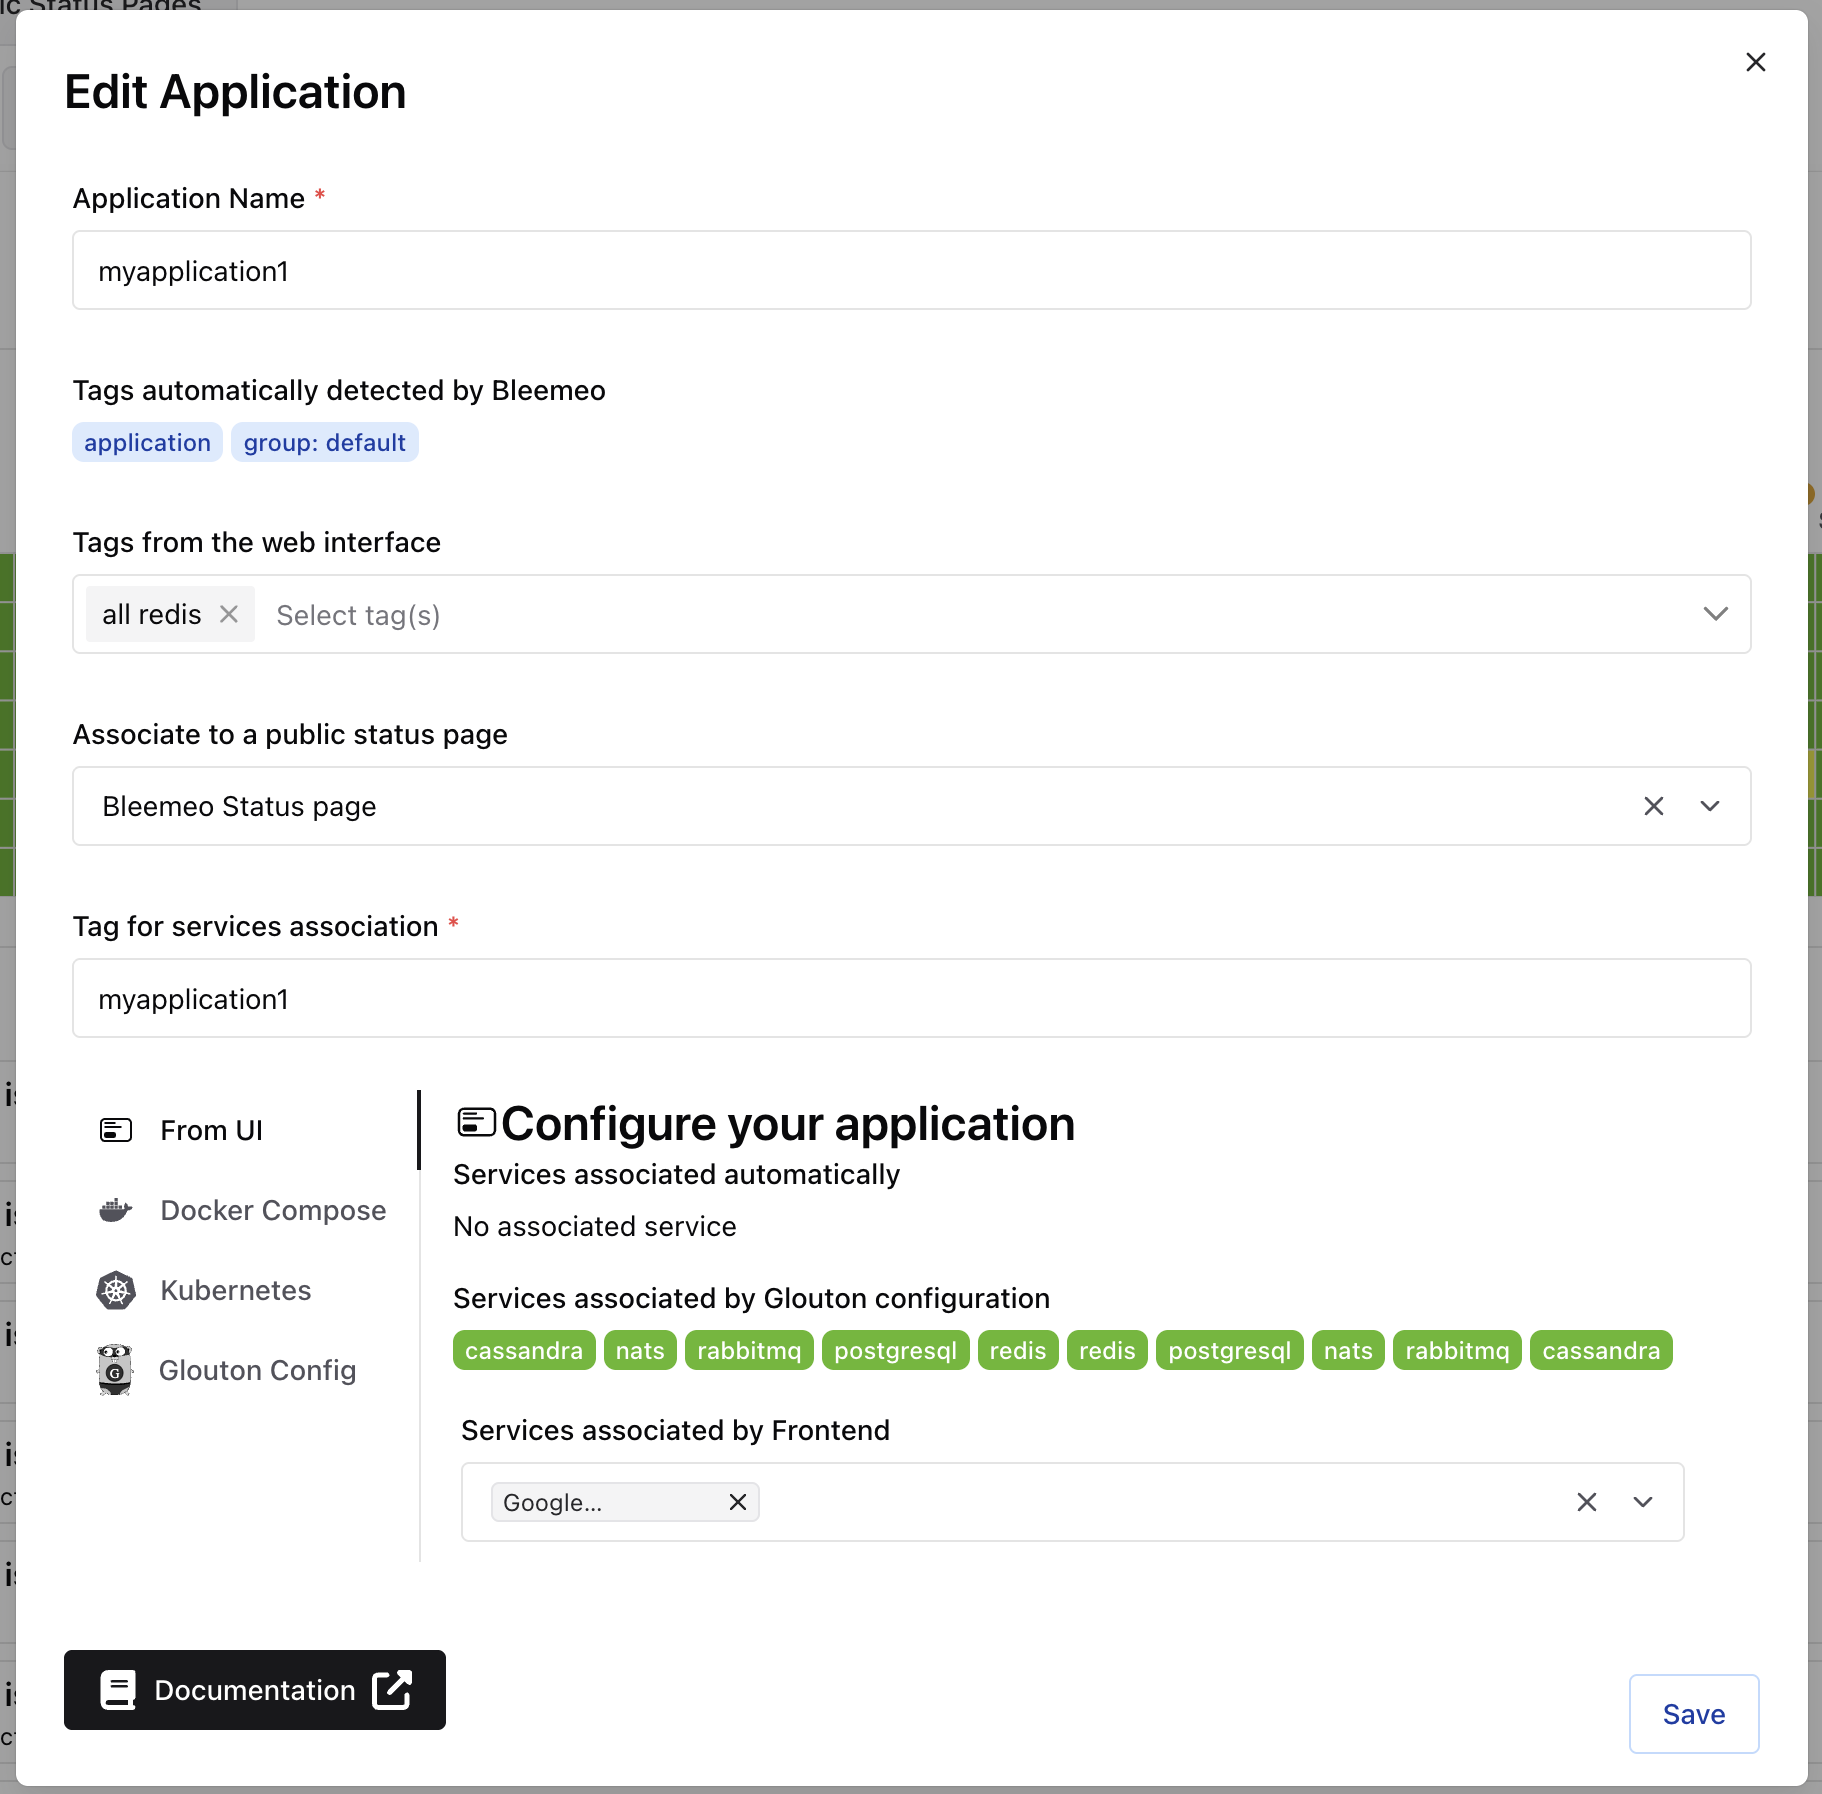
Section titled “From the web interface”You can see all the services that are associated with this application, and how the services are tagged. They can be tagged in three different ways:
- Automatically tagged by the API
- Tagged by a Glouton configuration
- Manually tagged by the web interface
Docker Compose
Section titled “Docker Compose”Glouton automatically creates an application for every Docker Compose project it detects. When a container carries the com.docker.compose.project label (set by Docker Compose itself), all services of the project are grouped under an application named after the project — no extra configuration is required. The corresponding tag is visible in the panel as an automatic tag.
If you want to attach containers from different Compose projects to the same application, or to override the default grouping, add the glouton.tags label to your Docker Compose file:
services: your-service-name: image: <your_service_image> labels: - glouton.tags=<application_tag>Multiple tags can be provided as a comma-separated list (for example glouton.tags=backend,payments).
Kubernetes
Section titled “Kubernetes”Add the following annotation to your deployment:
apiVersion: apps/v1kind: Deploymentmetadata: name: "my-service"spec: template: metadata: # Create the annotations on the pod, not on the deployment annotations: glouton.tags: "<application_tag>"Glouton Config
Section titled “Glouton Config”Add the following to your Glouton configuration in /etc/glouton/conf.d/90-application.conf:
services: - type: "apache" instance: "<name_of_a_container>" tags: - <application_tag>Web Interface
Section titled “Web Interface”Once the application has been created and services and/or monitors are tagged, you see the application details, which contain several tabs:
The dashboard can be edited; it will continue to update correctly when new services appear. You can always click the reset button to restore the dashboard you would have had if you hadn’t edited it.
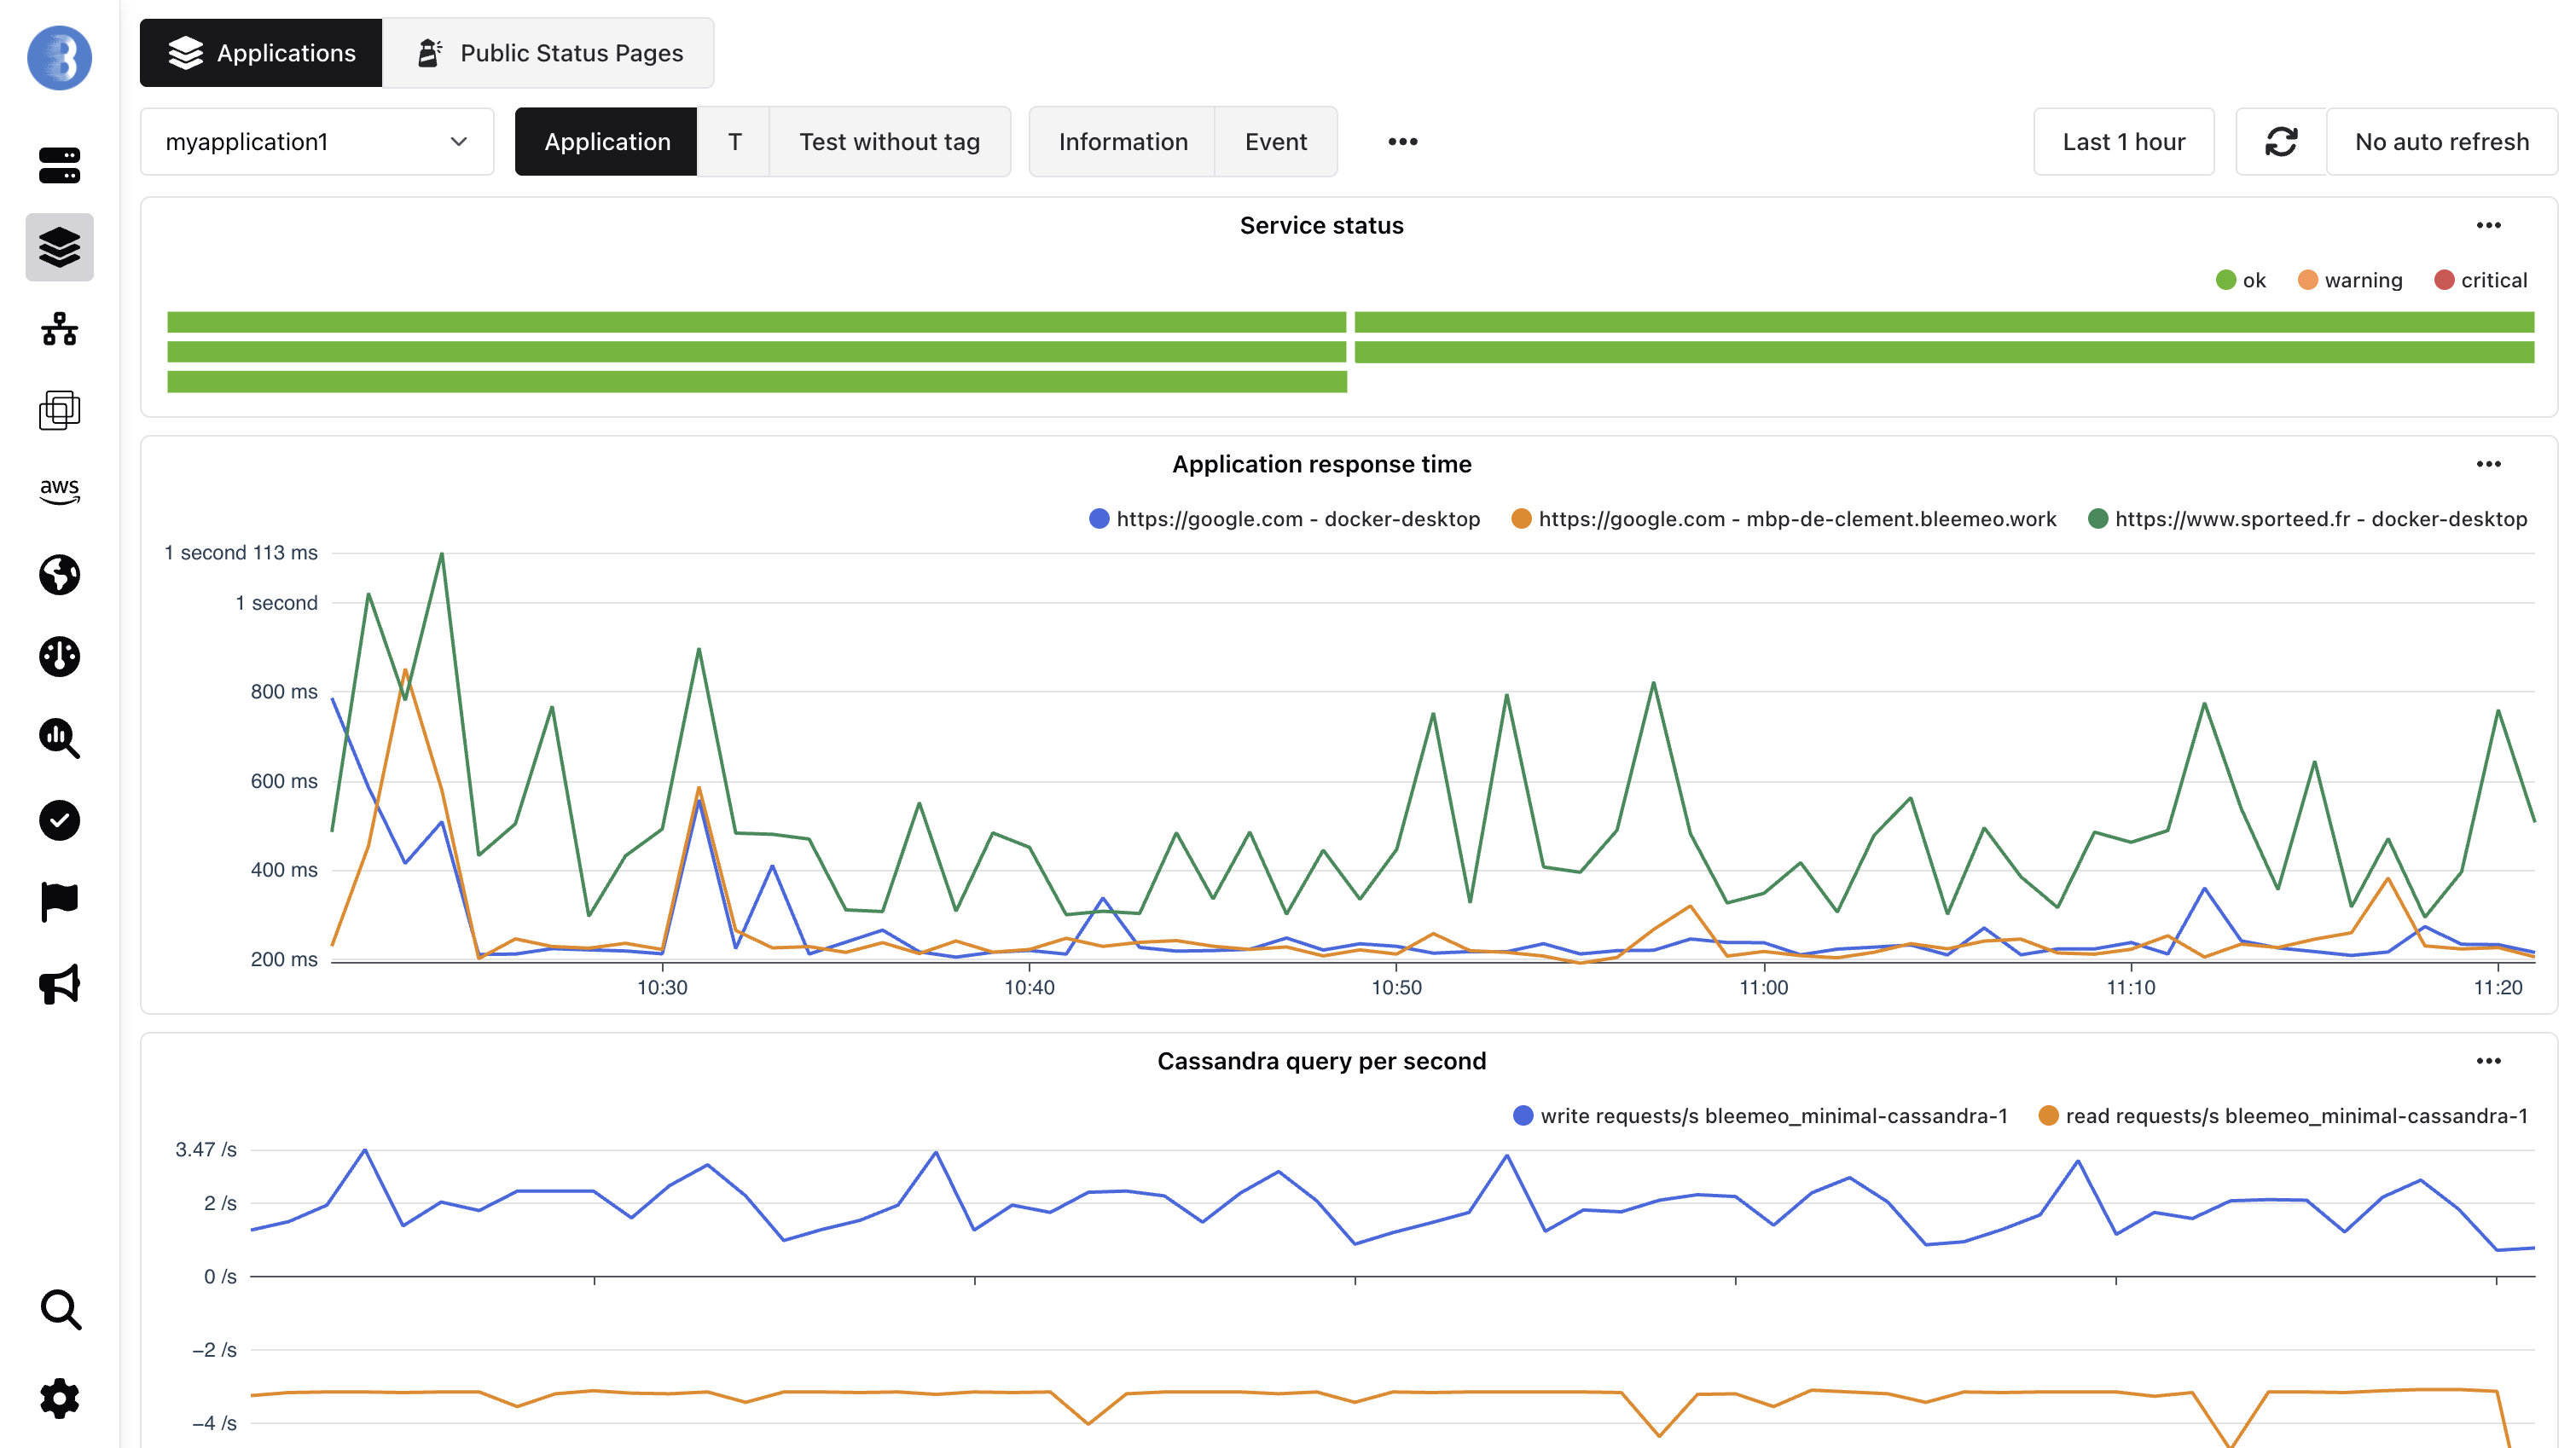
Dashboard
Section titled “Dashboard”The dashboard will always have the Service status with the status of all the services that have the application tag.
There can be an Application response time if you have added the application tag to one or more monitors.
For the Professional plan only, the dashboard will contain widgets for the services associated with the application tag.
Application Information
Section titled “Application Information”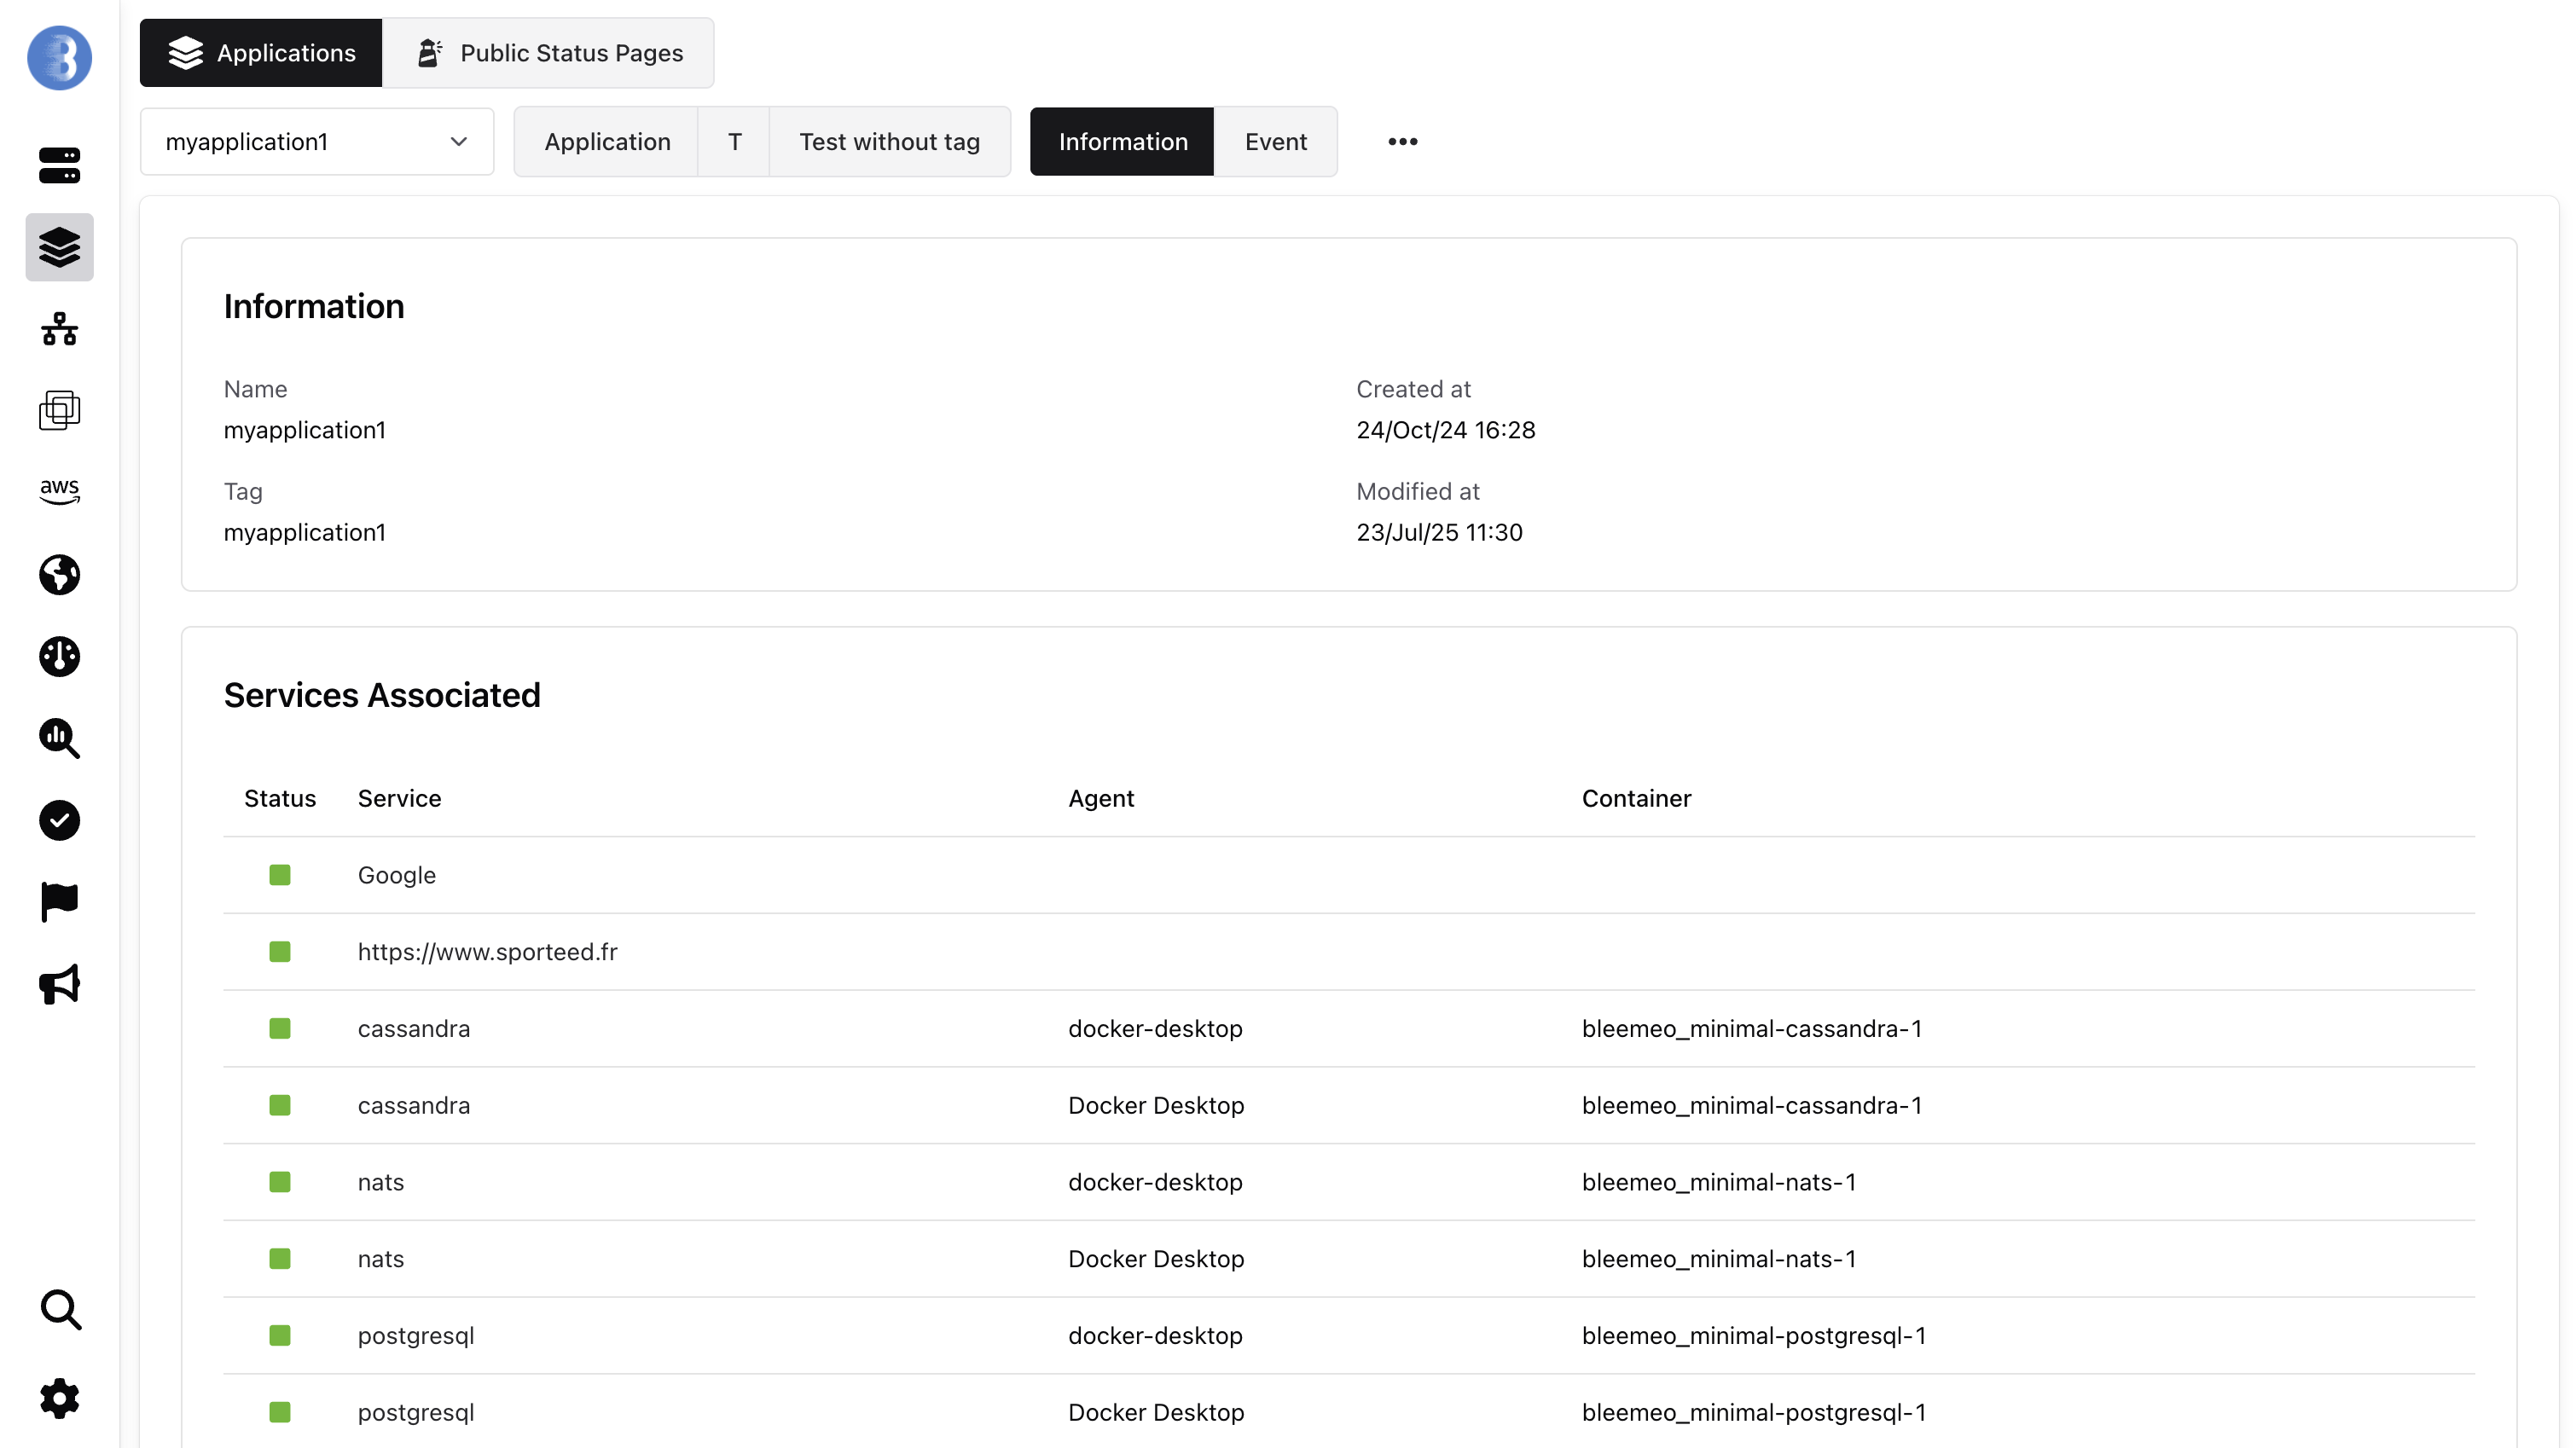
Application service events
Section titled “Application service events”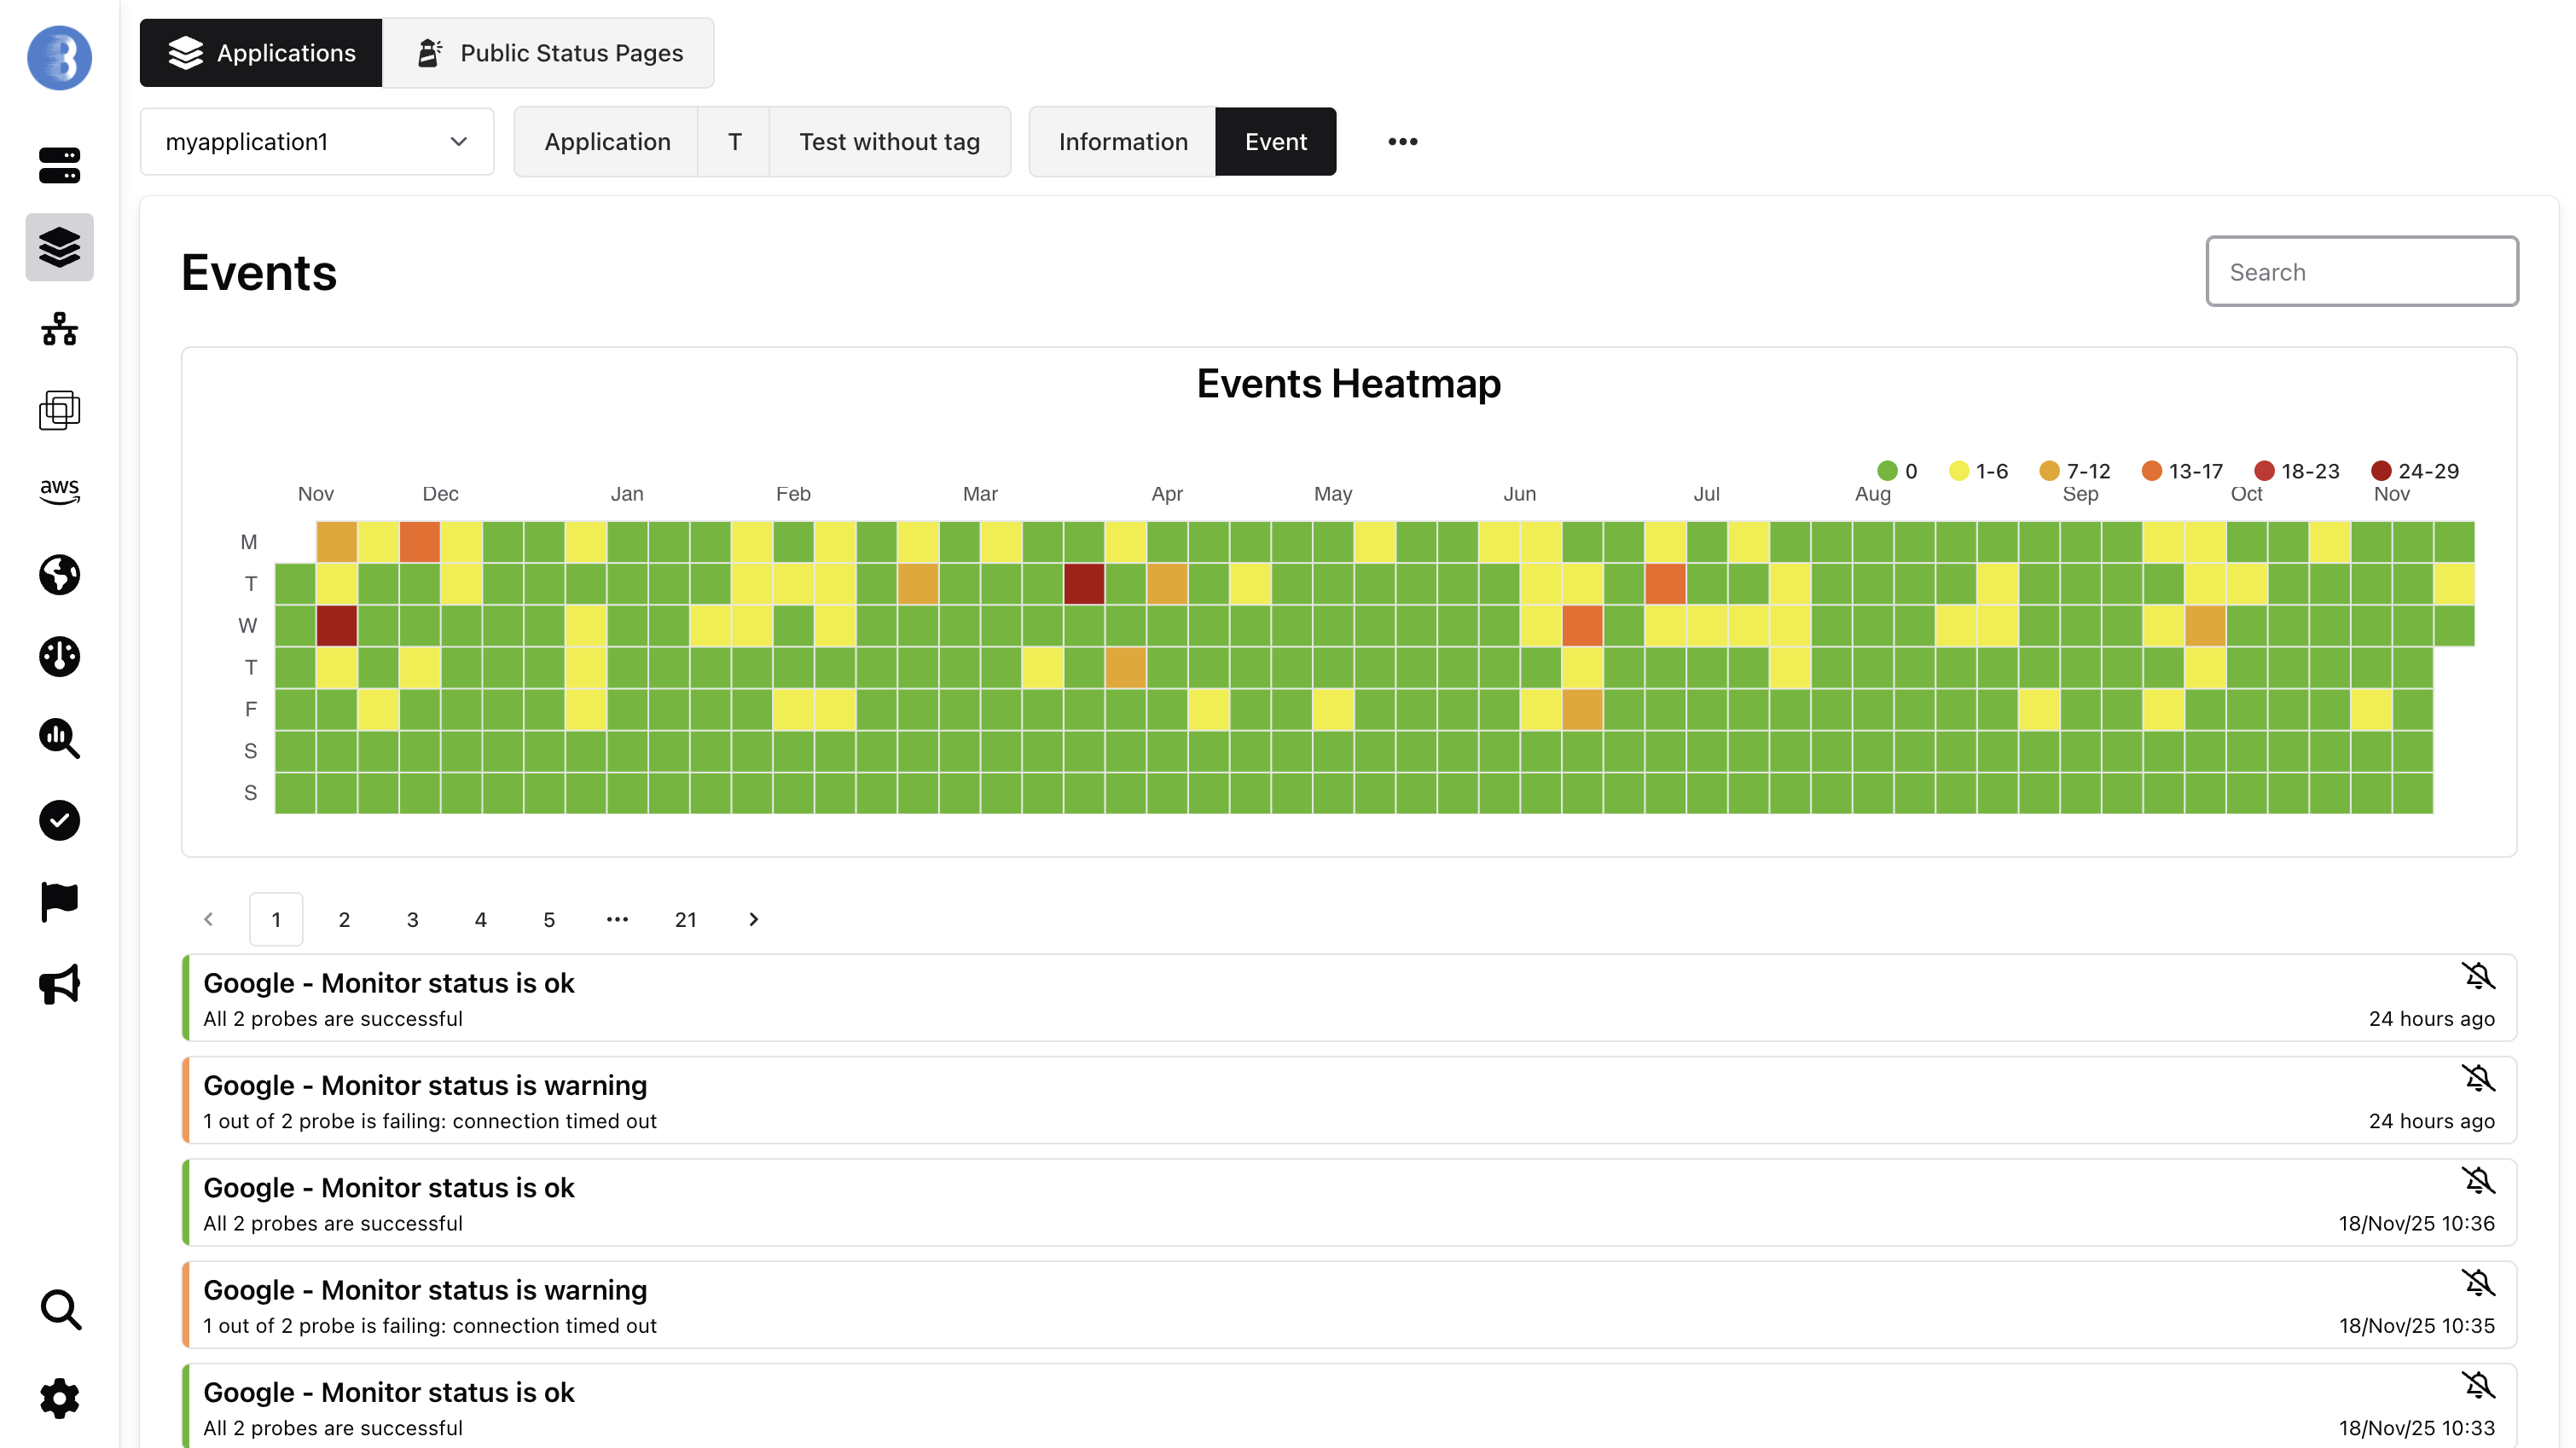
Share Application Health Publicly
Section titled “Share Application Health Publicly”An application’s real-time health can be published on a public status page so you can share uptime and incidents with your customers without exposing your account.