Status Dashboards
Free
Starter
Professional
On this page you can see a list of status. By default only the ones with problems are displayed.
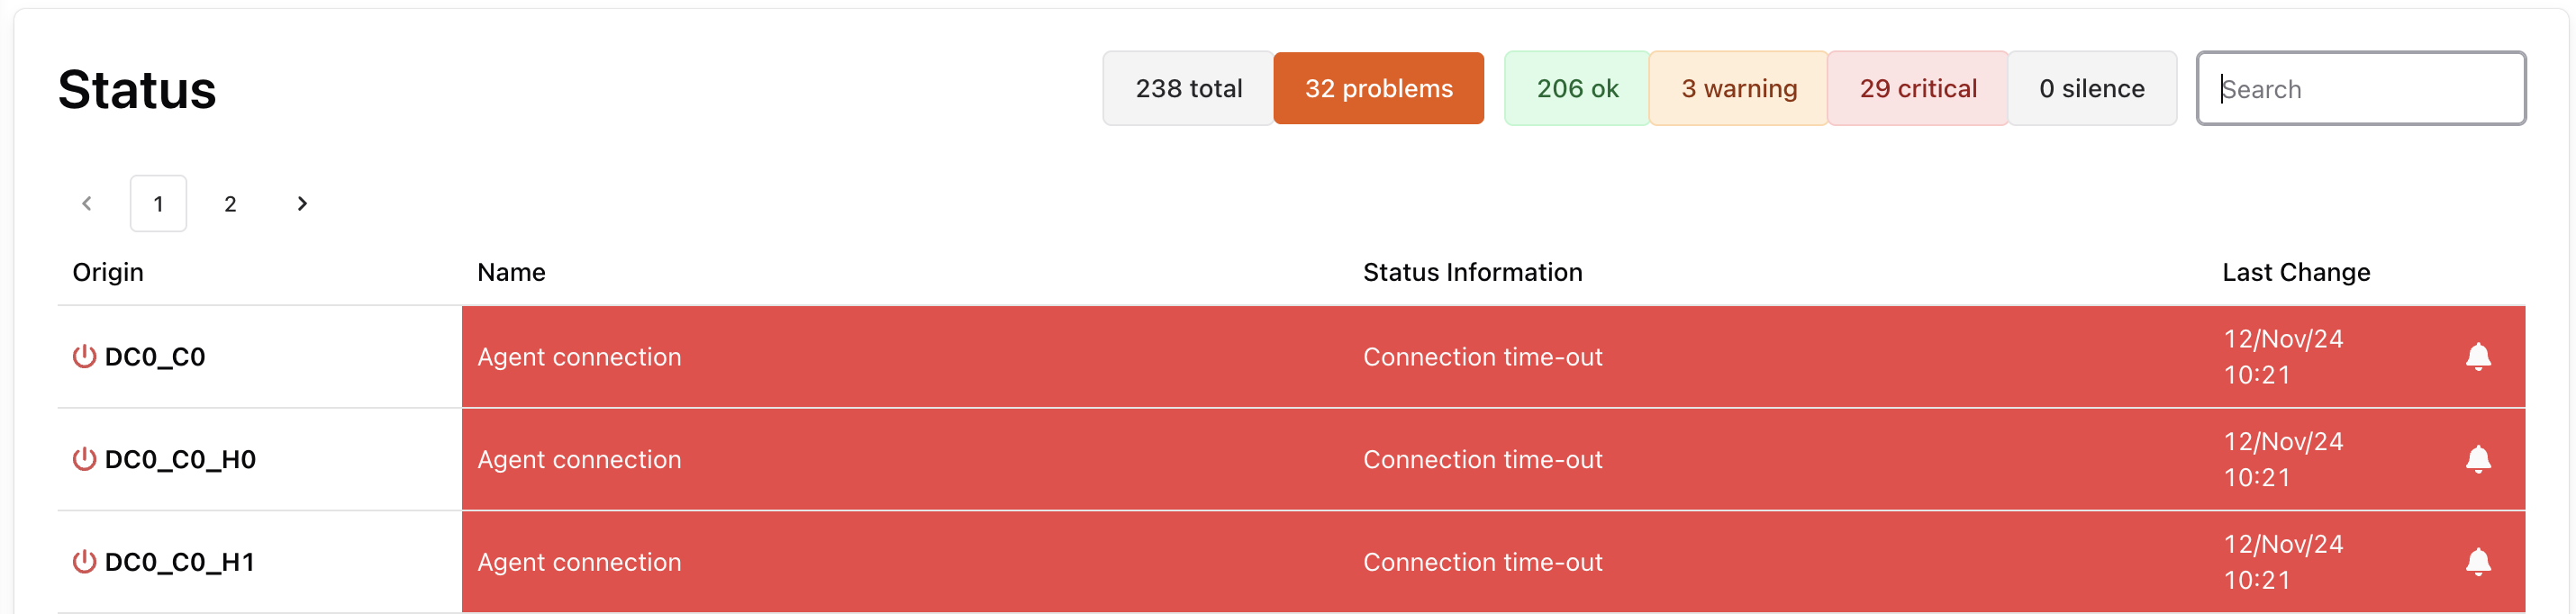
You can filter them by agent’s hostname or name, or display only the one with a specific status. The list is ordered by agent’s hostname and entity name.
The columns are:
- the agent’s hostname
- the entity name
- the state (OK, WARNING, CRITICAL)
- a text explaining the problem
- the date of the last change of state for this entity
- silence button
This page is useful to see at a glance which services or servers currently have problems. You can see your status dashboard.