

Dashboard Templates
On this page you can see a list of your dashboard templates, create a new one, edit or delete the existing ones.
Default Dashboard
Section titled “Default Dashboard”Each agent has a tag for its type. For example, when an agent has the server tag, a dashboard template named "Dashboard server" with the server tag is created.
This dashboard is a “system dashboard”; you can modify it in the dashboard templates list.
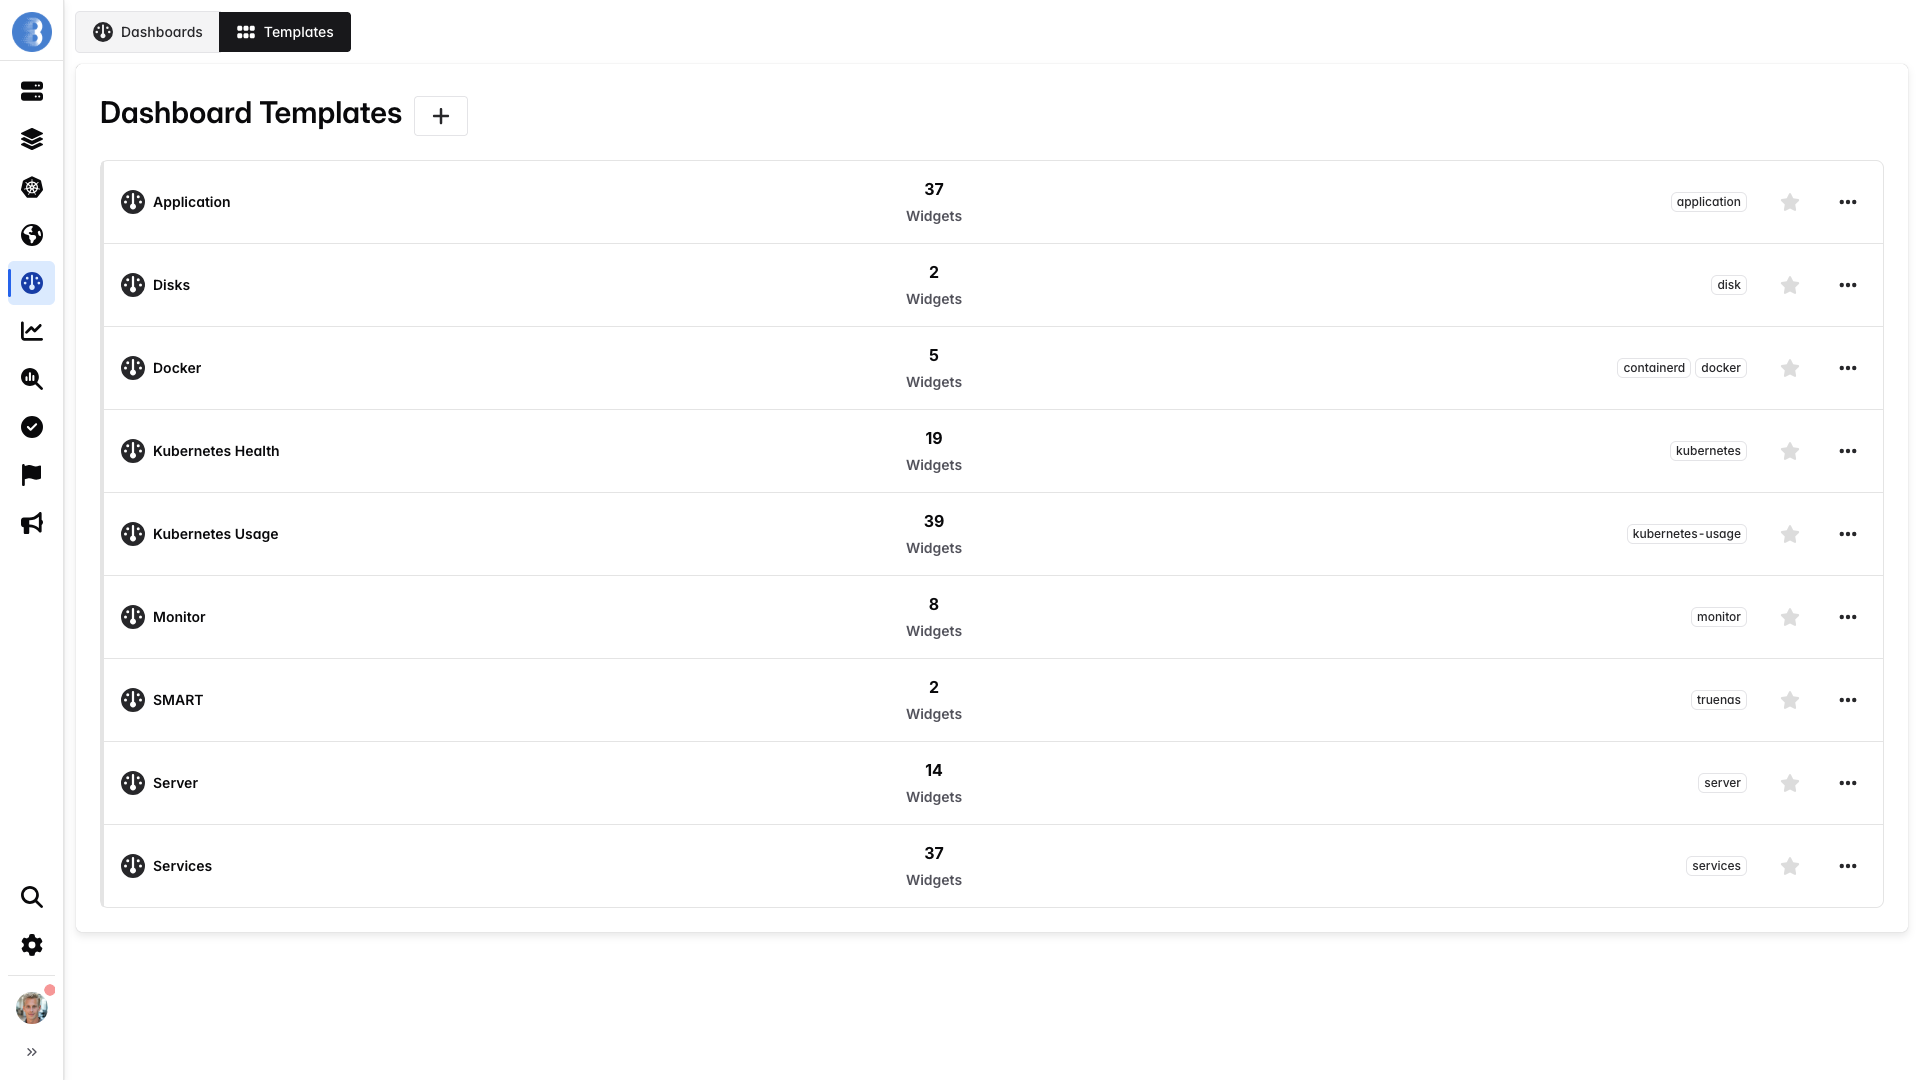
If you modify the default dashboard, all your agents with the server tag will have their dashboard modified.
Create Dashboard Template
Section titled “Create Dashboard Template”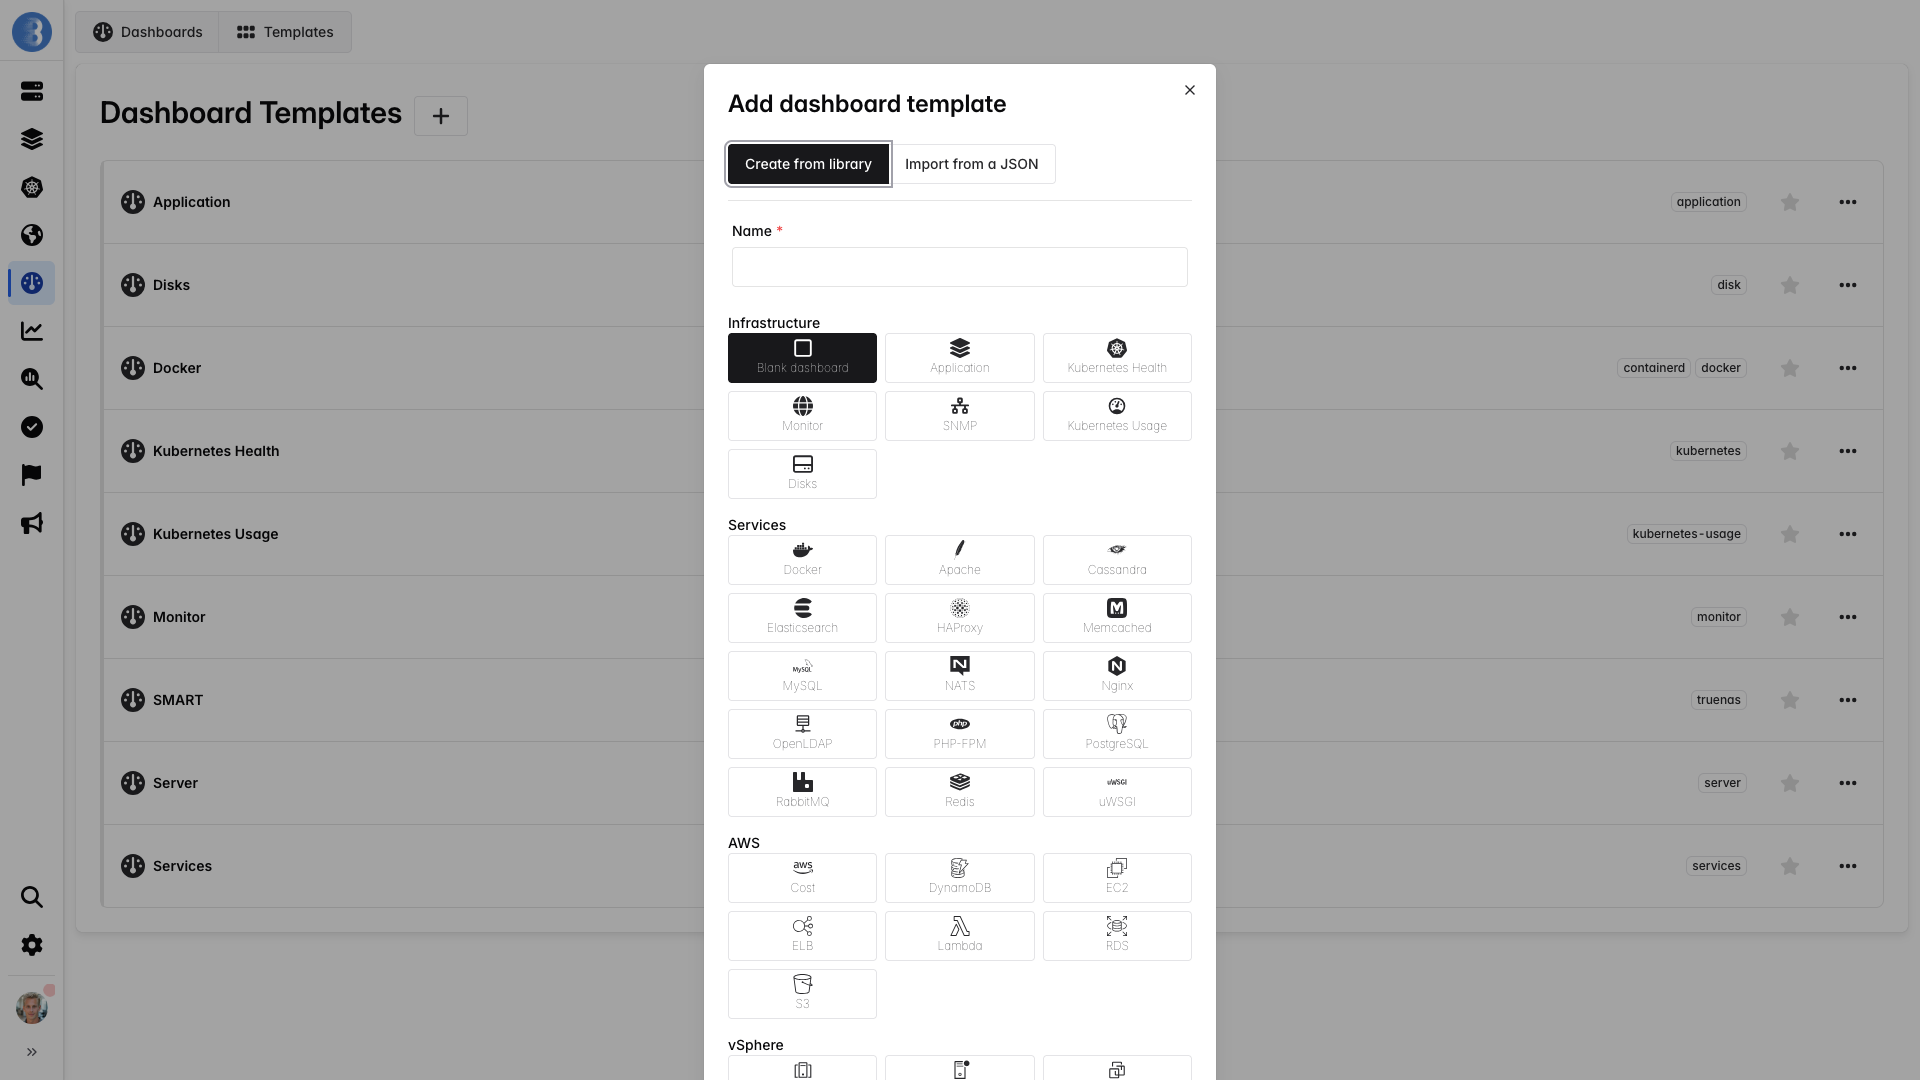
To create a dashboard template, you can choose a template layout to create widgets by default or use a blank layout. Each template layout is used to auto-generate a dashboard for each agent type. You can also create a template from a JSON file, see Import and Export.
If you create a dashboard template without a tag, it will appear in the list of dashboards for every agent’s details. But if you choose a tag, the dashboard will be displayed only on agents that have this tag.
In a widget, PromQL queries should use $INSTANCE_UUID instead of a specific instance.
Example:
avg_over_time(mem_used{instance_uuid="$INSTANCE_UUID"}[$__interval])$INSTANCE_UUID is replaced automatically by the agent UUID.
You can add tags to a dashboard template. If an agent has one of these tags, the dashboard will be displayed in the agent view.
If my agent has the tags Linux and Docker and I add the tag Linux to the dashboard template, this dashboard will be displayed in the agent view.
Import and Export
Section titled “Import and Export”Any dashboard can be exported as a JSON file with Export as a JSON in the dashboard menu. This file can then be imported back as a dashboard template: create a new template and select Import from a JSON instead of creating from the library. The template name and tags are pre-filled from the JSON file; you can override them before saving.
This lets you share dashboards between accounts, keep them under version control, or generate them programmatically — for example with the help of an AI assistant, by giving it the JSON format reference below together with the list of metric names you want to visualize.
JSON Format Reference
Section titled “JSON Format Reference”The imported file must be a single JSON object:
{ "title": "My dashboard", "tags": ["server"], "version": 1, "templating": { "list": [] }, "widgets": []}| Field | Type | Description |
|---|---|---|
title |
string | Default name of the imported template. |
tags |
array | Default tags; agents with one of these tags get the dashboard. |
version |
number | Format version, always 1. |
templating |
object | Reserved for future use, always { "list": [] }. |
widgets |
array | The widgets, see below. |
Each widget is an object:
{ "id": 0, "title": "CPU", "graph": 3, "unit": 1, "gridPos": { "x": 0, "y": 0, "w": 6, "h": 4 }, "min_value": 0, "max_value": 100, "bleemeo_queries": [ { "query": "avg_over_time(cpu_used{instance_uuid=\"$INSTANCE_UUID\"}[$__interval])", "legend_template": "used" } ]}| Field | Type | Required | Description |
|---|---|---|---|
id |
number | yes | Unique identifier within the file. |
title |
string | yes | Widget title. |
graph |
number | yes | Widget type, see graph types. |
unit |
number | yes | Unit of the values, see units. |
gridPos |
object | yes | Position and size on a 24-column grid: x, y, w, h. |
min_value |
number | no | Lower bound of the axis or gauge. |
max_value |
number | no | Upper bound of the axis or gauge. |
format |
string | no | Unit text displayed when unit is 7 (custom), e.g. "RPM". |
graph_subtype |
number | no | Variant for status (0 round, 1 smiley, 2 image) and heatmap (100 range, 101 status) widgets. |
custom_min_step |
number | no | Custom resolution in seconds for this widget. |
hideable |
bool | no | Hide the widget when it has no data. |
bleemeo_queries |
array | see note | Queries on metrics collected by the agent. |
Each entry of bleemeo_queries is an object:
| Field | Type | Required | Description |
|---|---|---|---|
query |
string | yes | The PromQL query. |
legend_template |
string | yes | Legend of the series; labels are available as {{ label }}. |
color |
string | no | Fixed color for the series. |
As in any dashboard template, queries should use the $INSTANCE_UUID variable instead of a specific
instance, and the $__interval / $__rate_interval variables for range selectors.
Graph Types
Section titled “Graph Types”| Value | Type |
|---|---|
| 0 | Line |
| 1 | Stacked |
| 3 | Gauge |
| 5 | Number |
| 6 | Status |
| 7 | SNMP status |
| 8 | Text |
| 9 | Image |
| 10 | Heatmap |
| 11 | Bar |
| 12 | Logs |
| Value | Unit |
|---|---|
| 0 | No unit |
| 1 | % |
| 2 | Byte |
| 3 | Bit |
| 4 | IO/s |
| 5 | /s |
| 6 | Second |
| 7 | Custom (text taken from the format field) |
| 8 | Day |
| 9 | °C |
| 10 | Byte/s |
| 11 | Bit/s |
| 12 | Hz |
| 13 | Watt |
Edit Dashboard Template
Section titled “Edit Dashboard Template”You can click on the edit icon  to edit the widget.
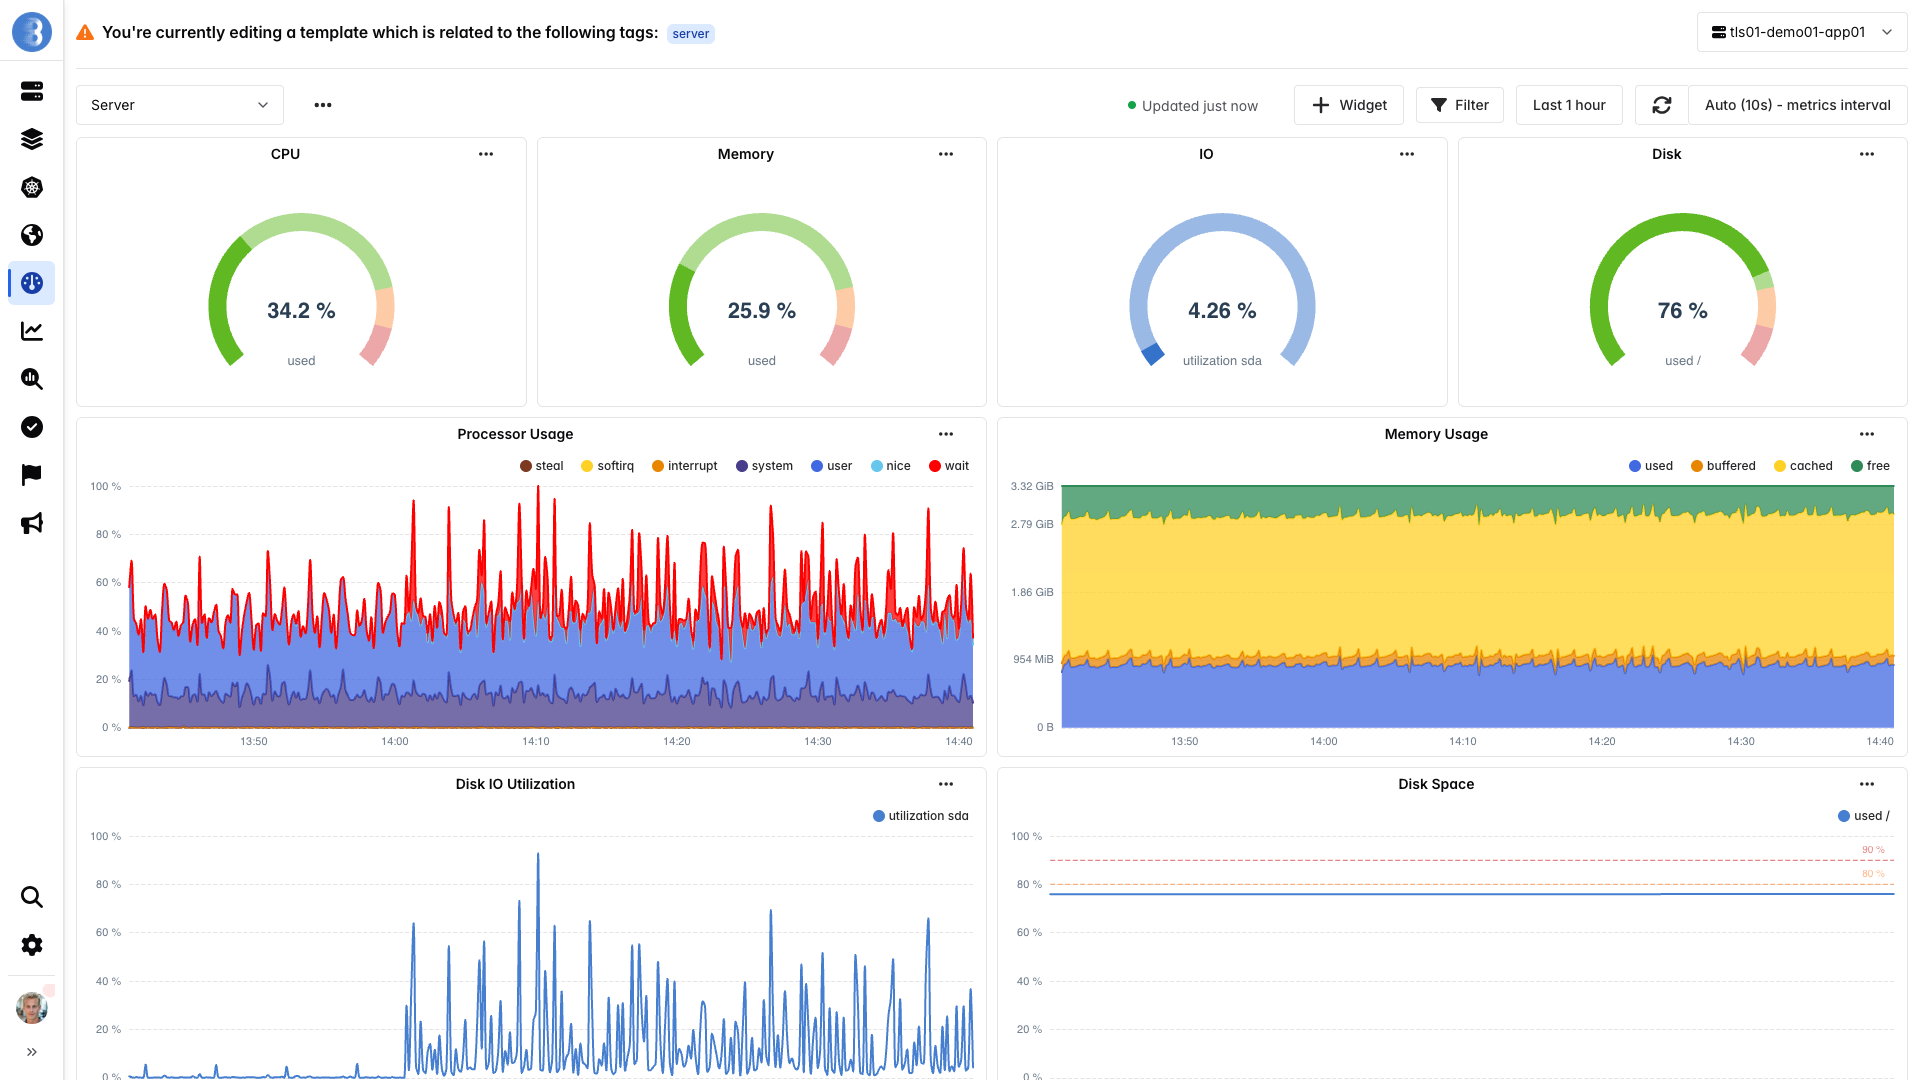
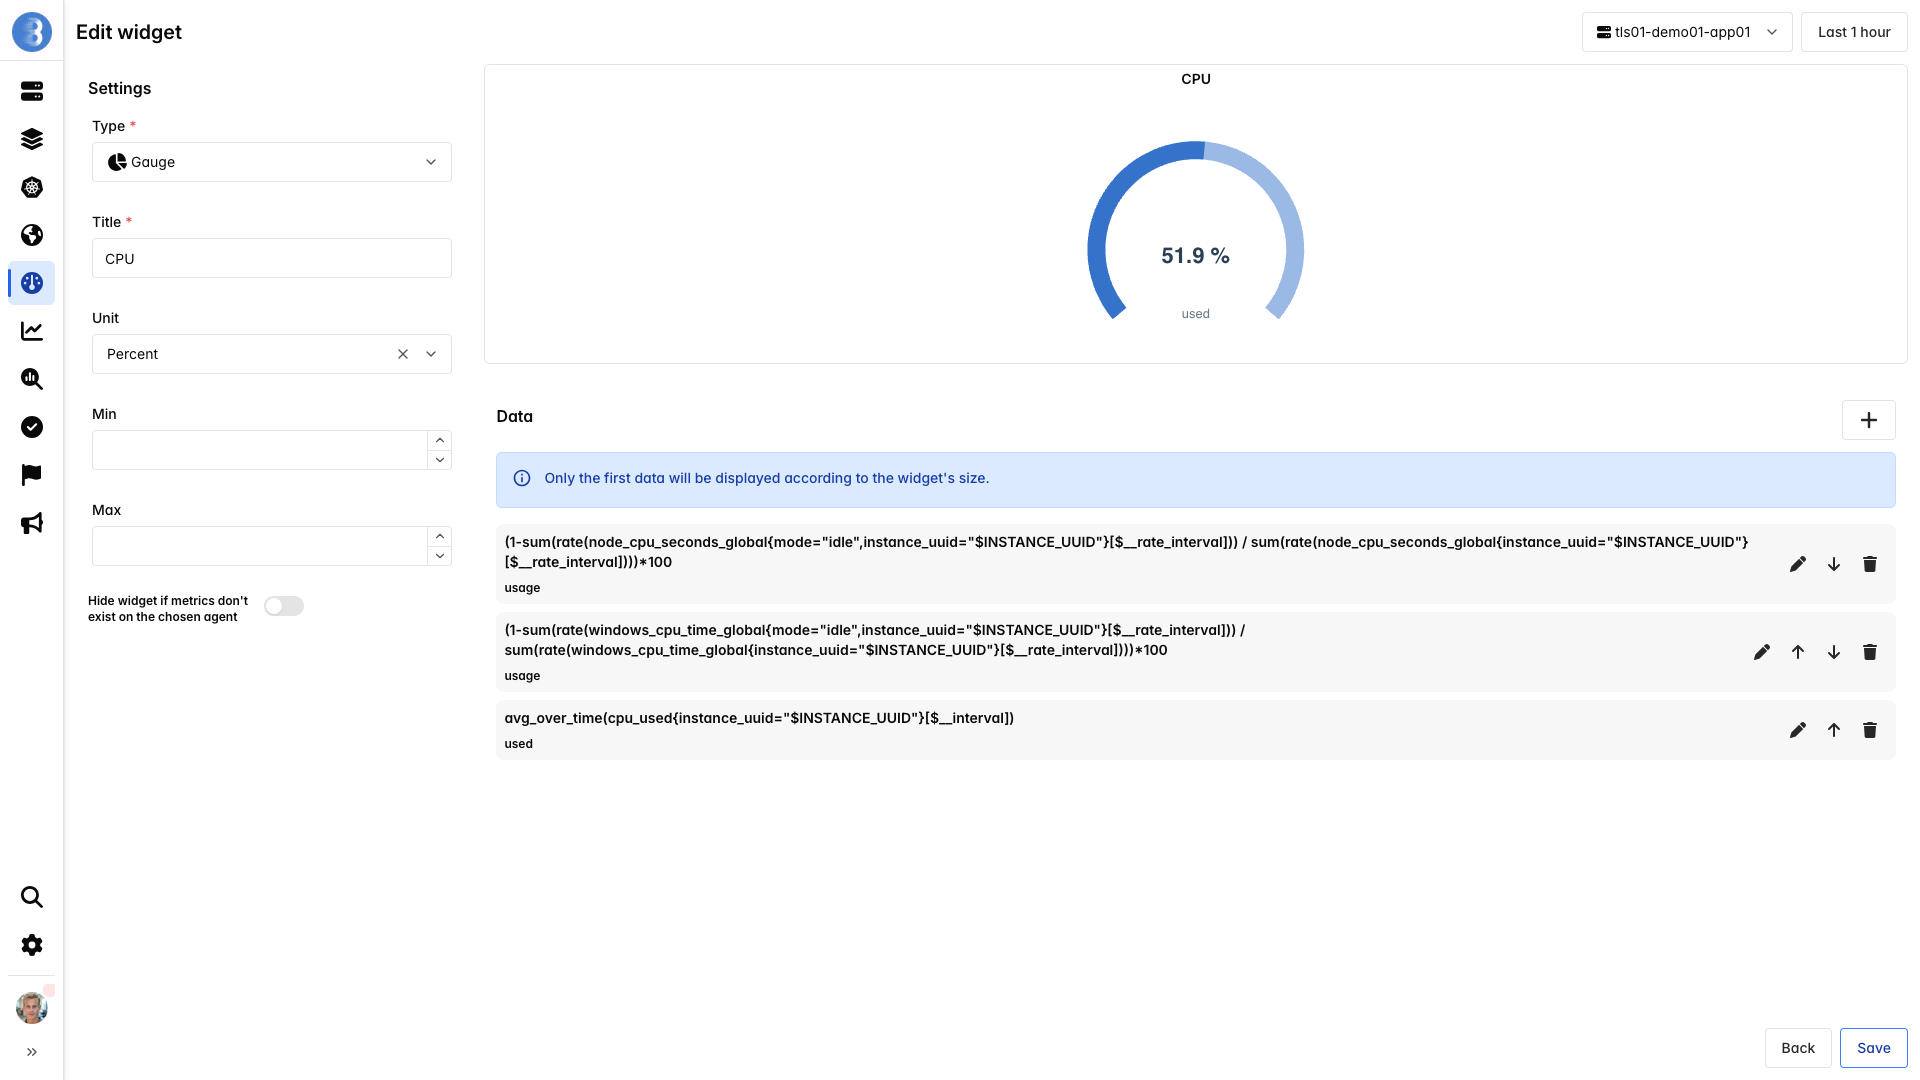
If you want to edit a widget of an automatically created dashboard template, you will see multiple PromQL queries, one for each OS (Linux, Windows, and macOS); only the PromQL that returns data will be displayed.
Clone Dashboard
Section titled “Clone Dashboard”You can click on the clone icon  to clone the dashboard.
Dashboard cloning works on dashboards and dashboard templates.
This creates an identical dashboard by adding
to clone the dashboard.
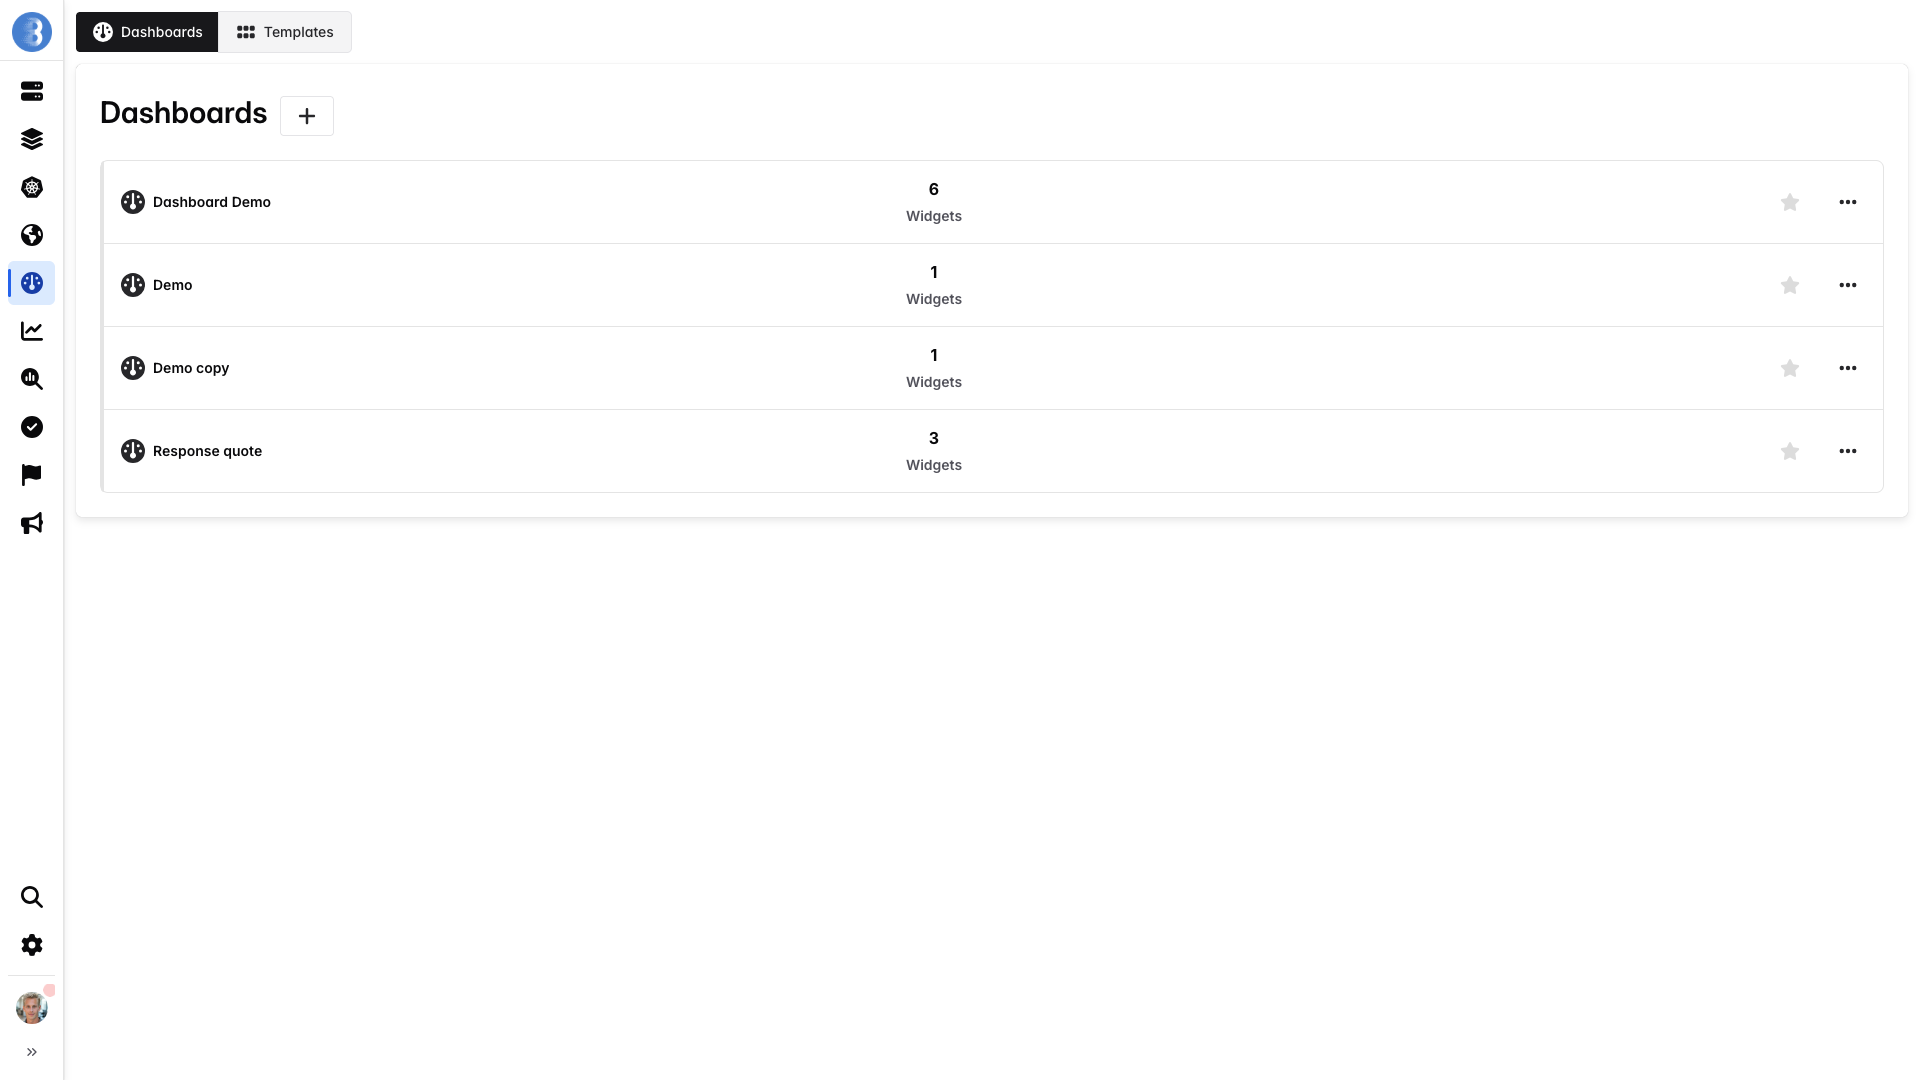
Dashboard cloning works on dashboards and dashboard templates.
This creates an identical dashboard by adding copy at the end of the dashboard name.
Reset Dashboard
Section titled “Reset Dashboard”You can click on the reset icon  to reset the dashboard.
Dashboard reset only works on dashboard templates.
For example, if a dashboard was created with a
to reset the dashboard.
Dashboard reset only works on dashboard templates.
For example, if a dashboard was created with a server template layout and a user modified widgets in this dashboard,
it’s possible to reset the dashboard to recreate the template layout widgets.