Configuration
Access the Glouton local panel
Section titled “Access the Glouton local panel”- Linux : you can simply open http://127.0.0.1:8015.
- MacOS & Windows : you have to enable the Enable host networking beta feature (see this) from Docker settings (see Features in development in the settings tab). Then, you can open http://127.0.0.1:8015.
Grafana
Section titled “Grafana”To setup Grafana, you can open http://localhost:3000 and login with the credentials admin/admin. You will be prompted to change this password.
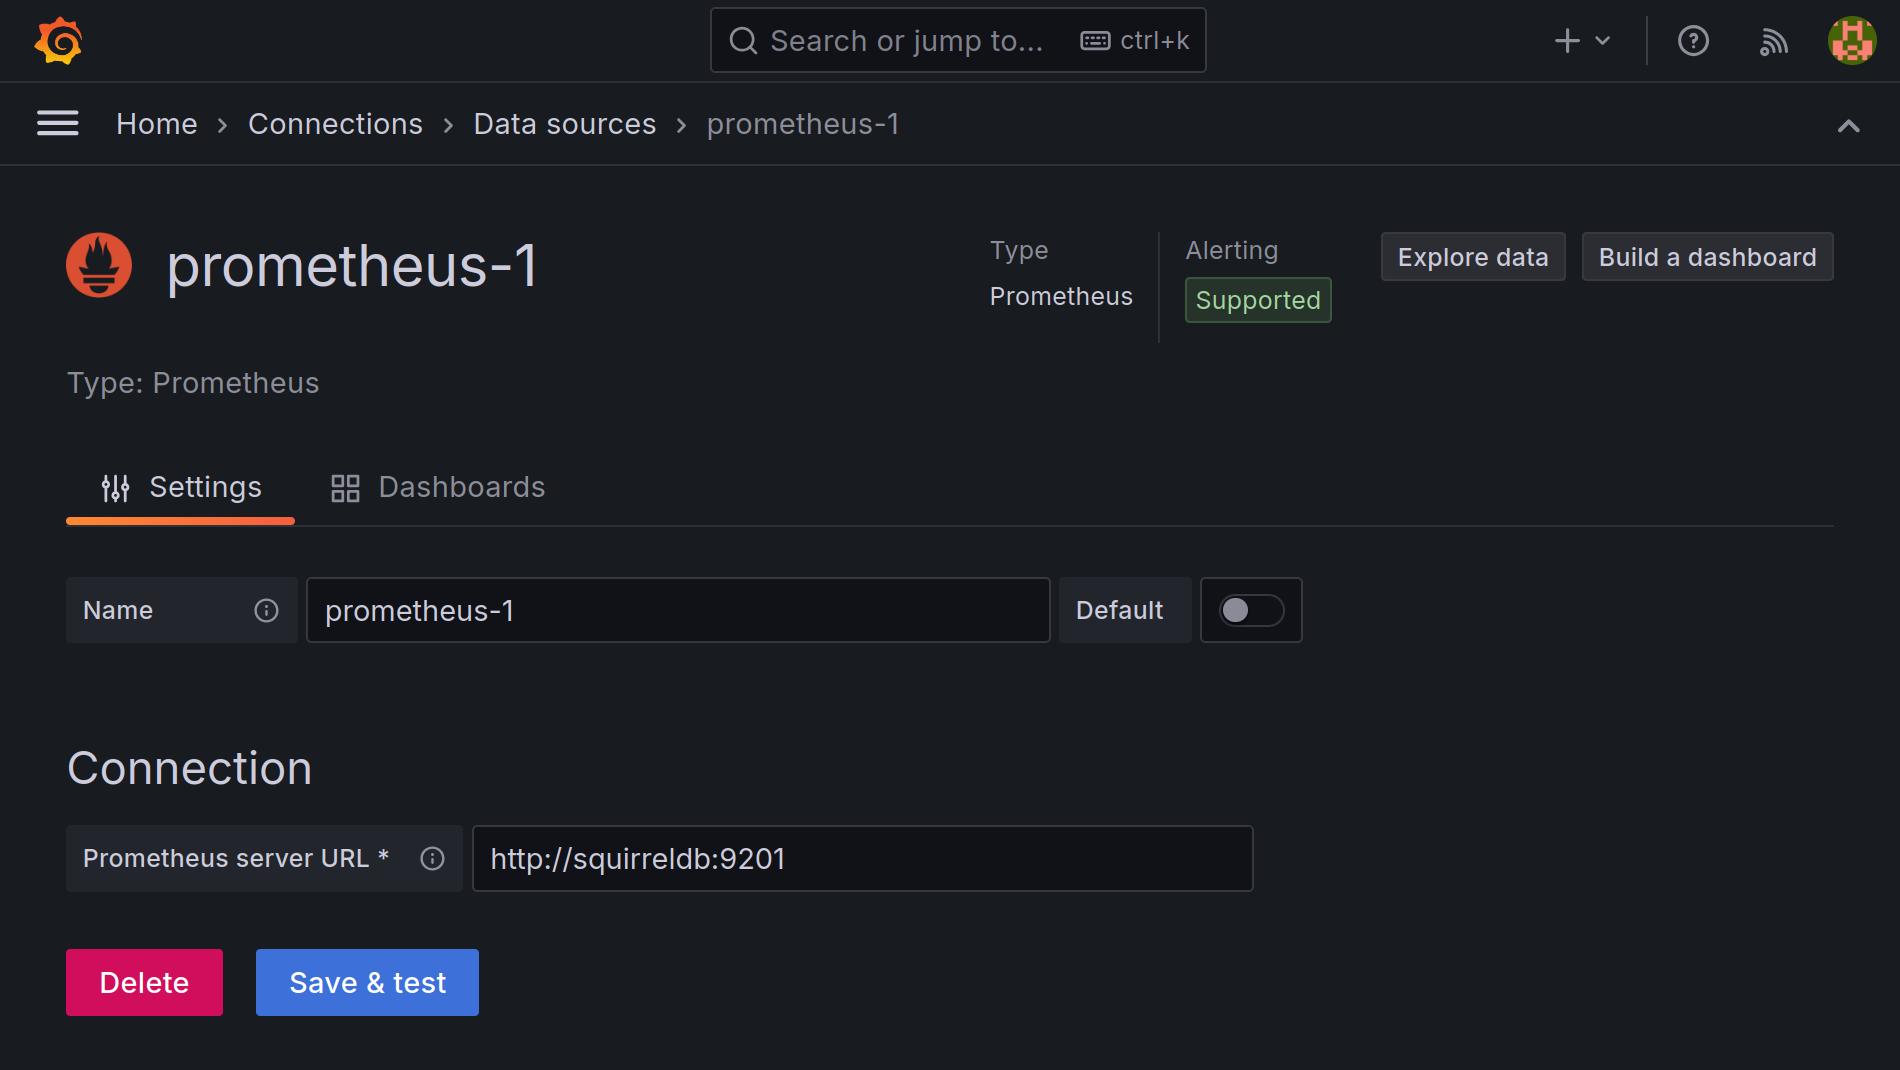
Next you need to add SquirrelDB as a Prometheus source, with the URL http://squirreldb:9201.
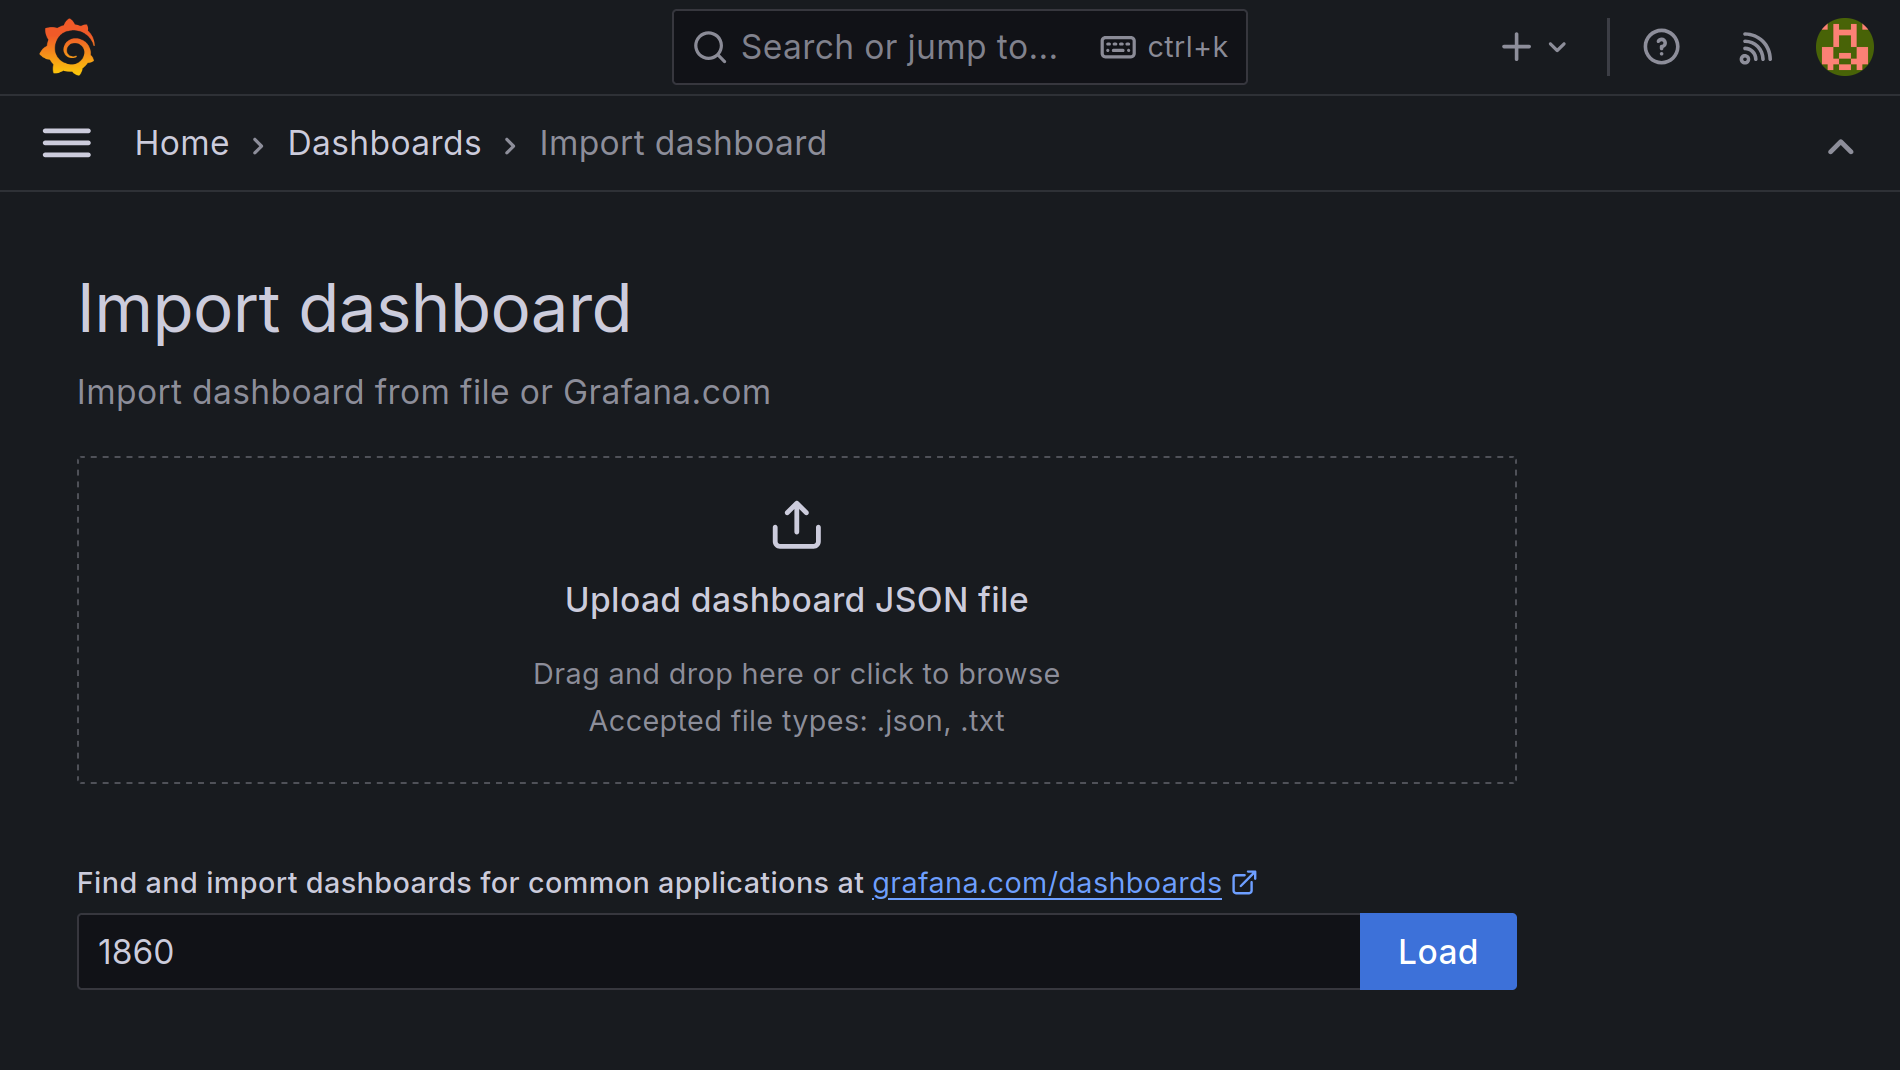
Then import the Node Exporter dashboard with the ID 1860, using the SquirrelDB
data source we just configured.
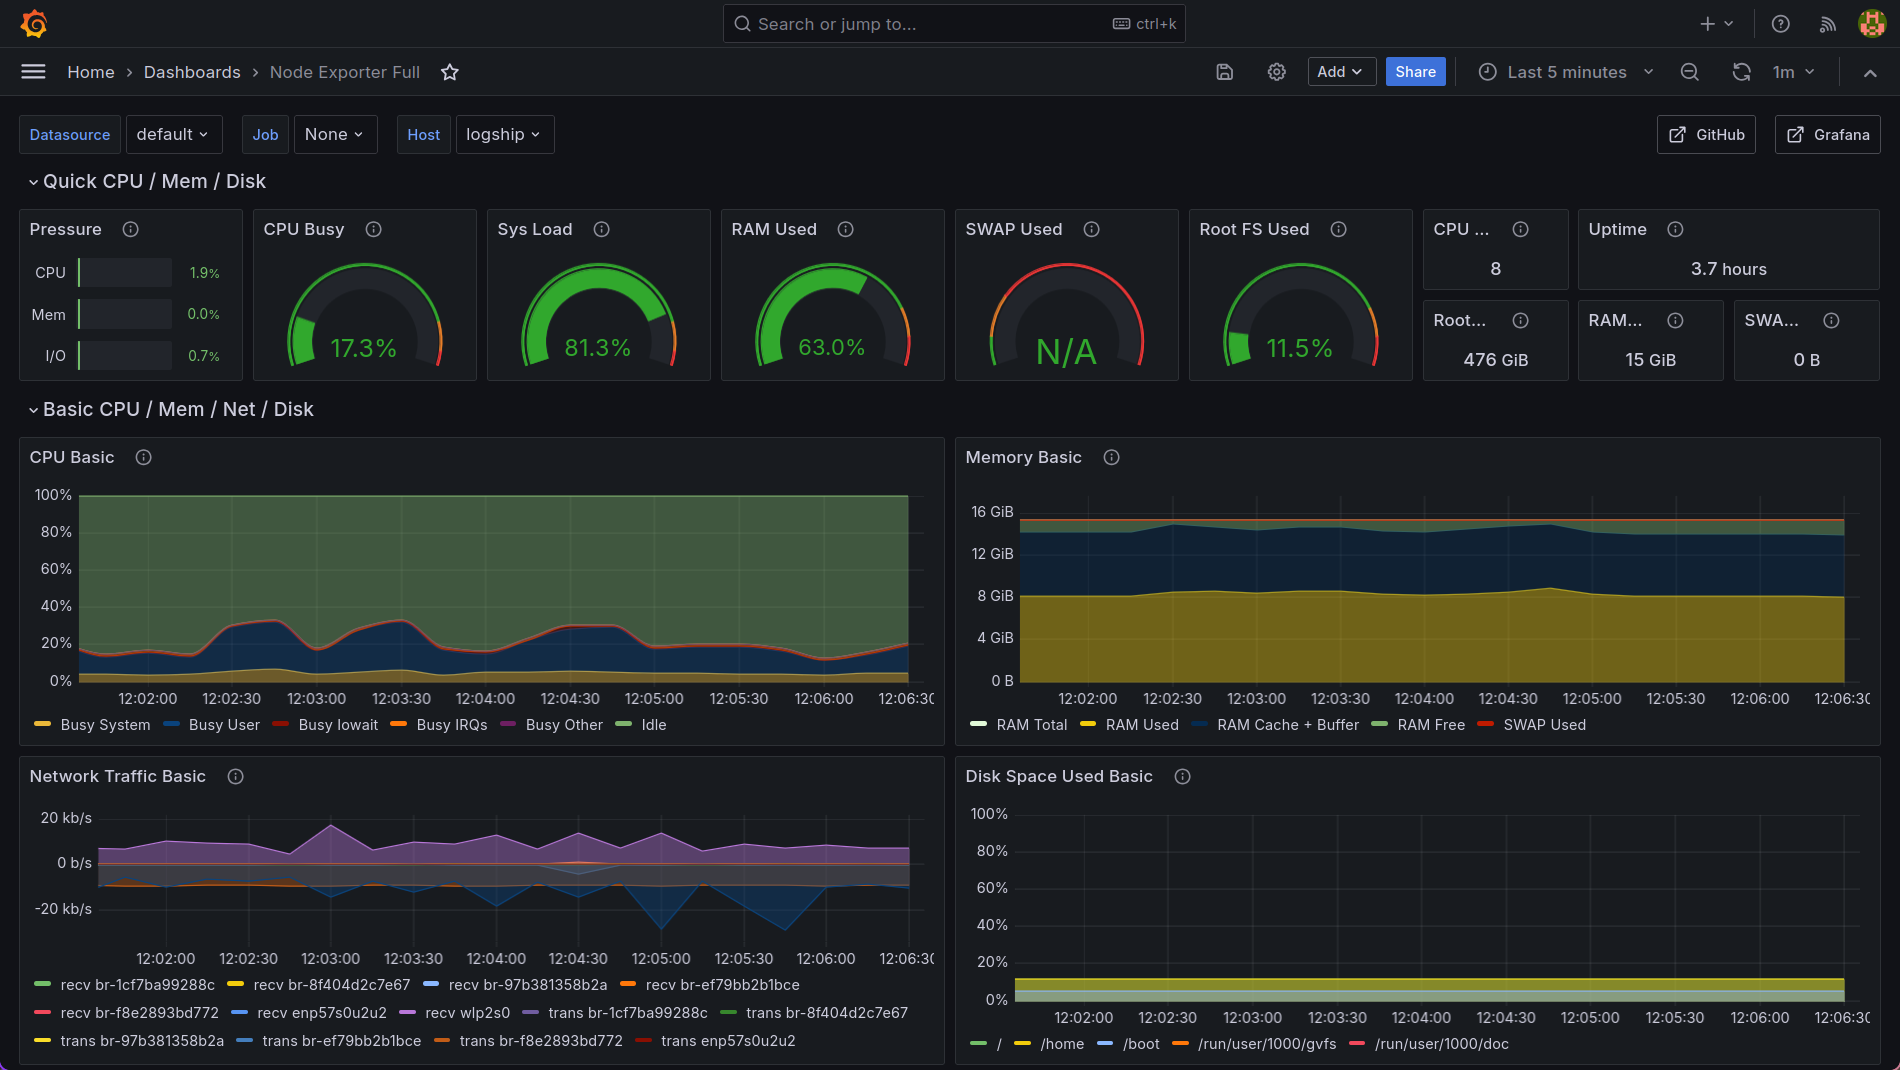
Now, you should see the system metrics gathered by the agent.
Next steps
Section titled “Next steps”Now that your have successfully deployed the Bleemeo Community Edition
You can secure your installation, for this see the security section or setup high availability with the HA section.