Applications Monitoring
Applications monitoring allows to view the health of a cluster, multiples services are shown on one graph. New services are automatically added to the graph and removed when the service is removed.
Create / Edit Application
You can create an application from the Applications tab on the left of the panel, by clicking on the +.
All you have to do is give your application a name and a tag, the tag can be an existing tag (in which case all the services or monitors that have this tag will be added automatically), otherwise you can create a new tag that you can add to your various services or monitors.
Once the application has been created, you have several ways of adding or removing a service or monitor:
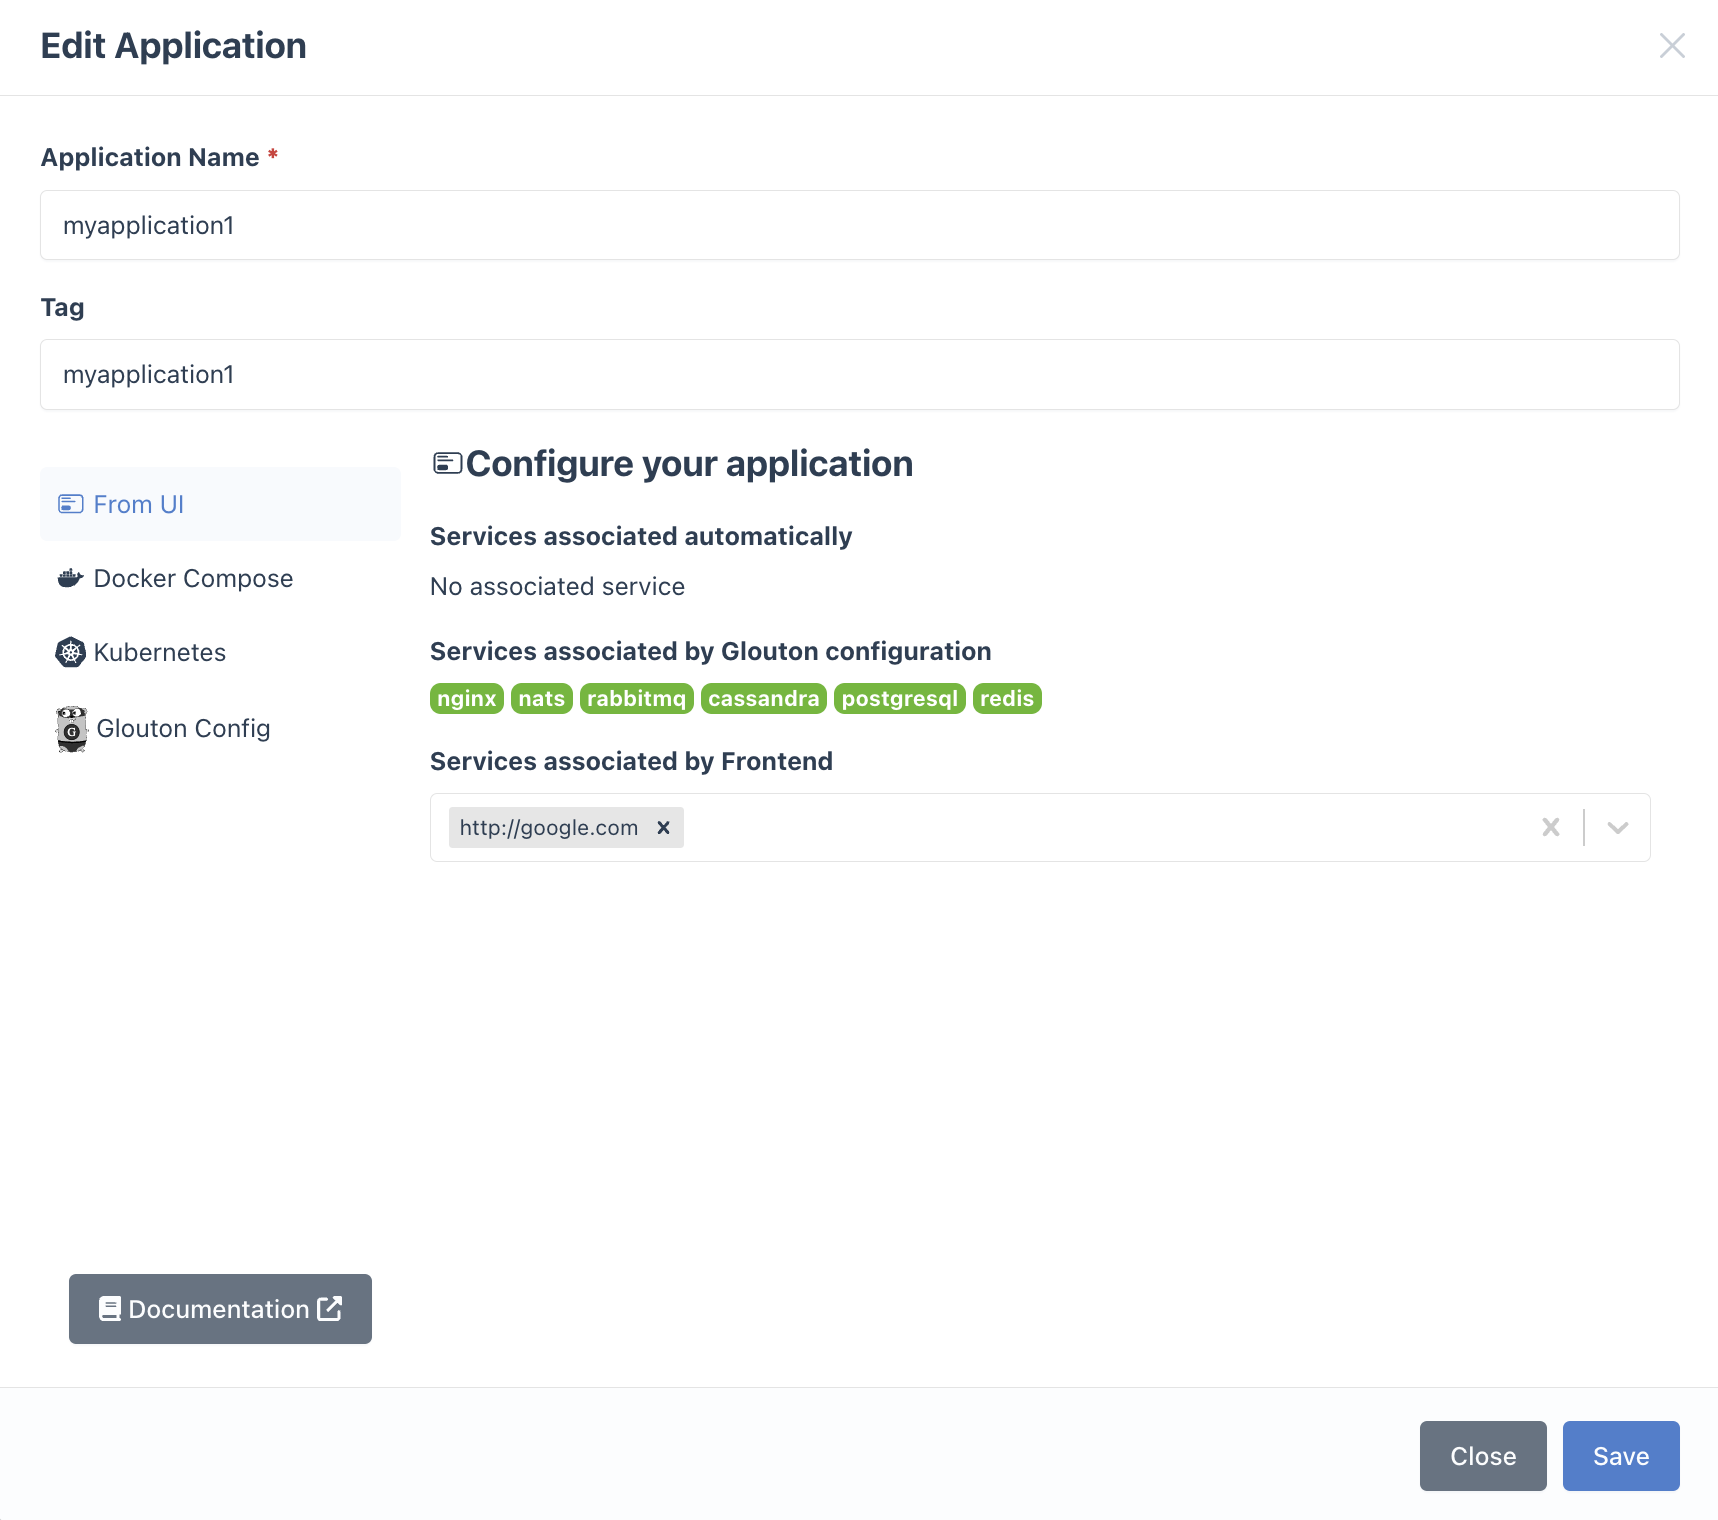
From the web interface
You can see all the services that are associated with this application, and how the services are tagged. They can be tagged in 3 different ways:
- Automatically tagged by the API
- Tagged by a Glouton configuration
- Manually tagged by the web interface
Docker Compose
Configure your Docker Compose file:
services:
  your-service-name:
    image: <your_service_image>
    labels:
      - glouton.tags=<application_tag>
Kubernetes
Add the following annotation to your deployment:
apiVersion: apps/v1
kind: Deployment
metadata:
  name: "my-service"
spec:
  template:
    metadata:
      # Create the annotations on the pod, not on the deployment
      annotations:
        glouton.tags: "<application_tag>"
Glouton Config
Add the following to your Glouton configuration in /etc/glouton/conf.d/90-application.conf:
services:
  - type: "apache"
    instance: "<name_of_a_container>"
    tags:
      - <application_tag>
Web Interface
Once the application has been created and services and/or monitors are tagged, we have the application details, in which we have several tabs:
The dashboard can be edited, it will continue to update correctly if new services appear, you can always click on the button reset to restore the dashboard you would have if you hadn't edited it.
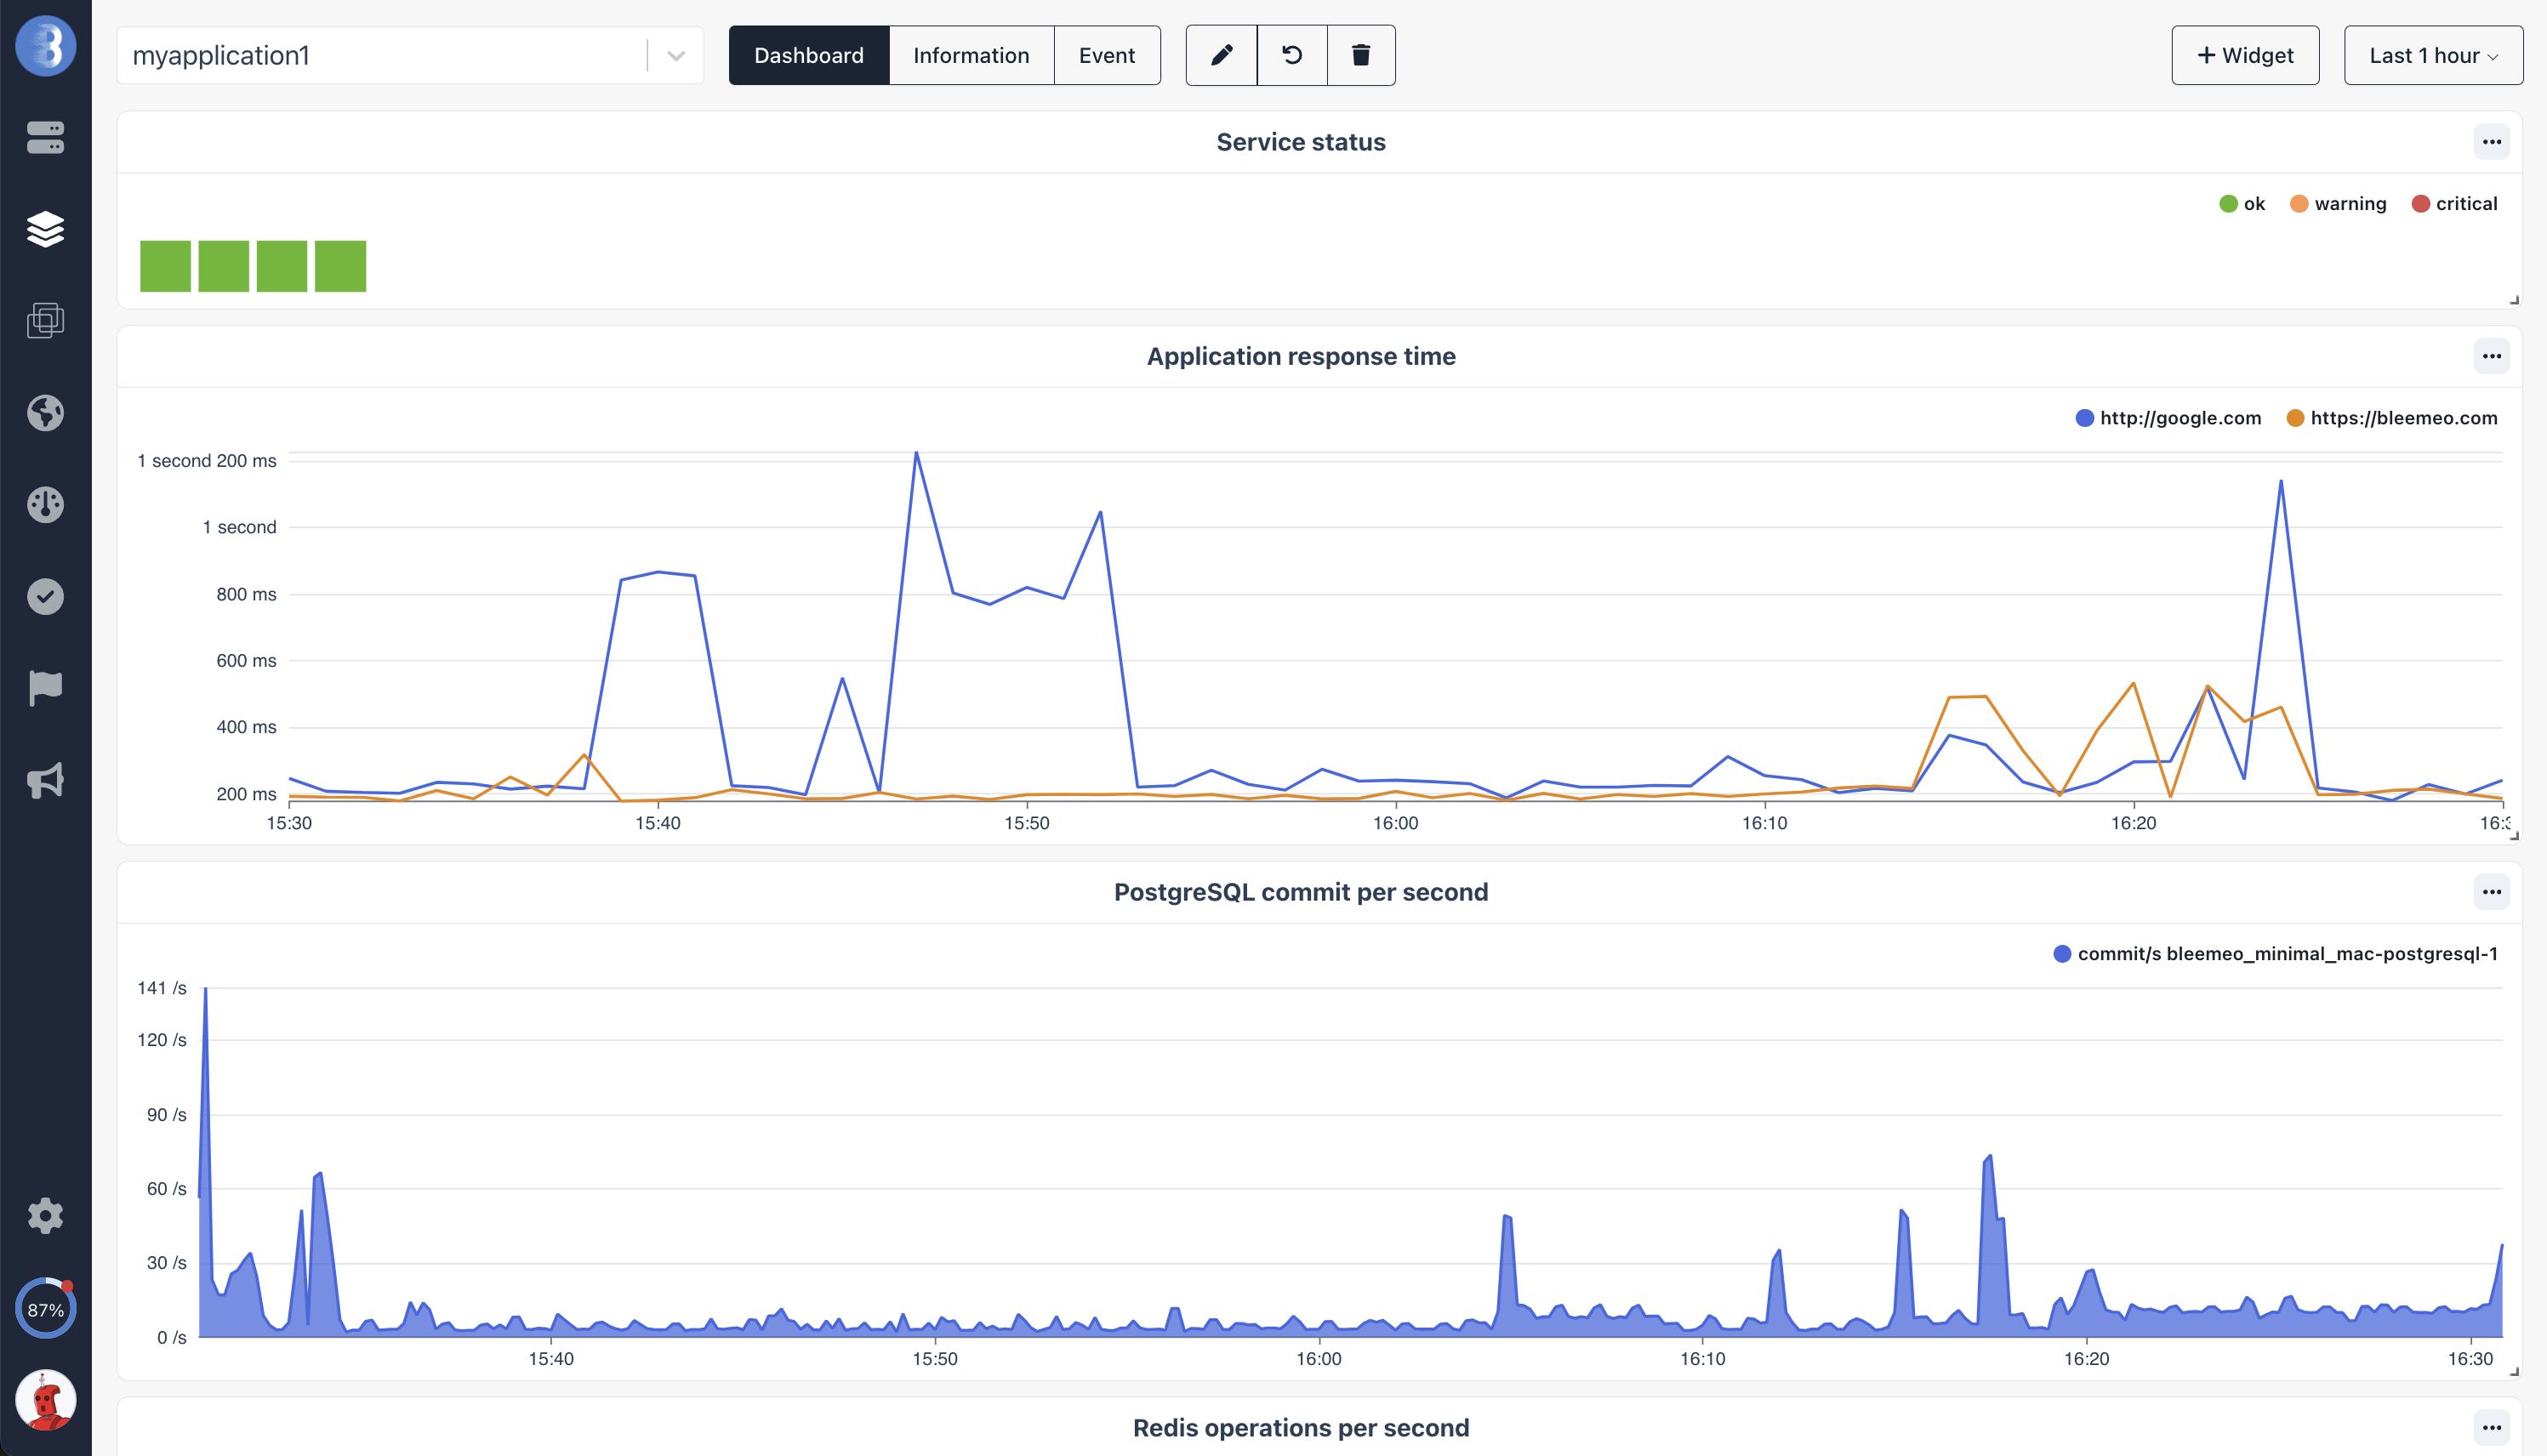
Dashboard
The dashboard will always have the Service status with the status of all the services that have the application tag.
There can be an Application response time if you have added the application tag to one or more monitors.
For Professional plan only the dashboard will contain widgets of the services associated with the application tag.
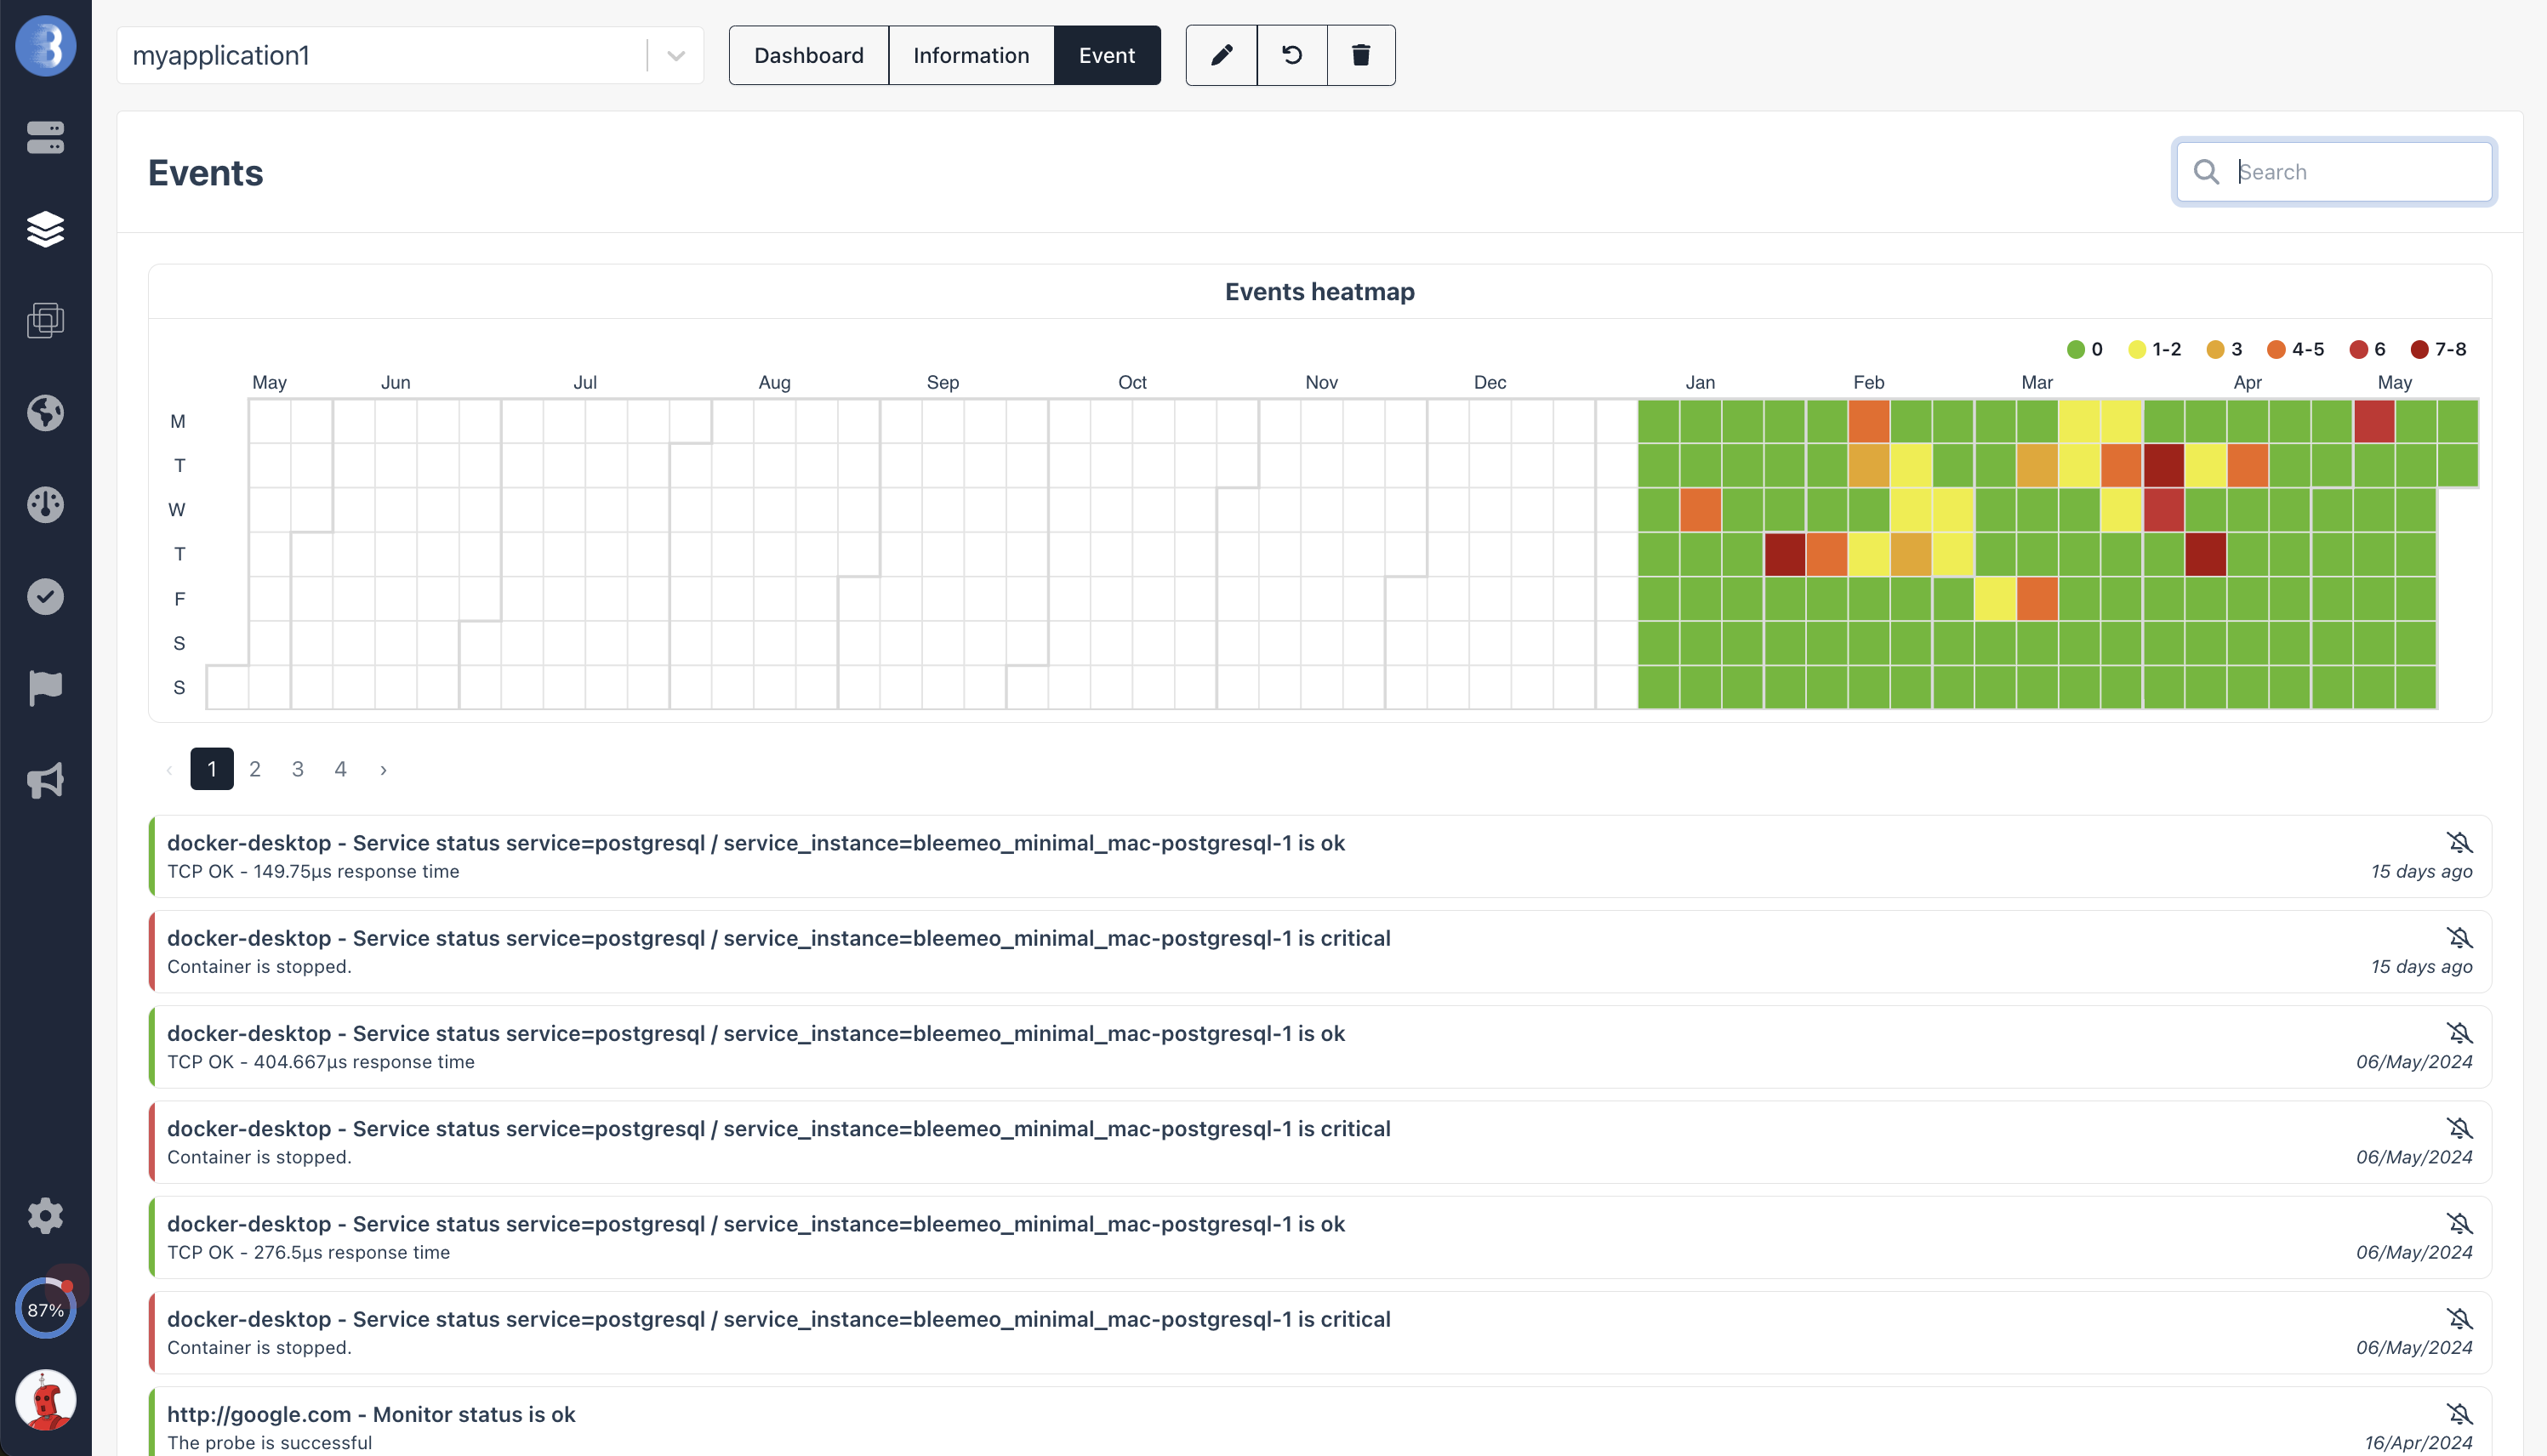
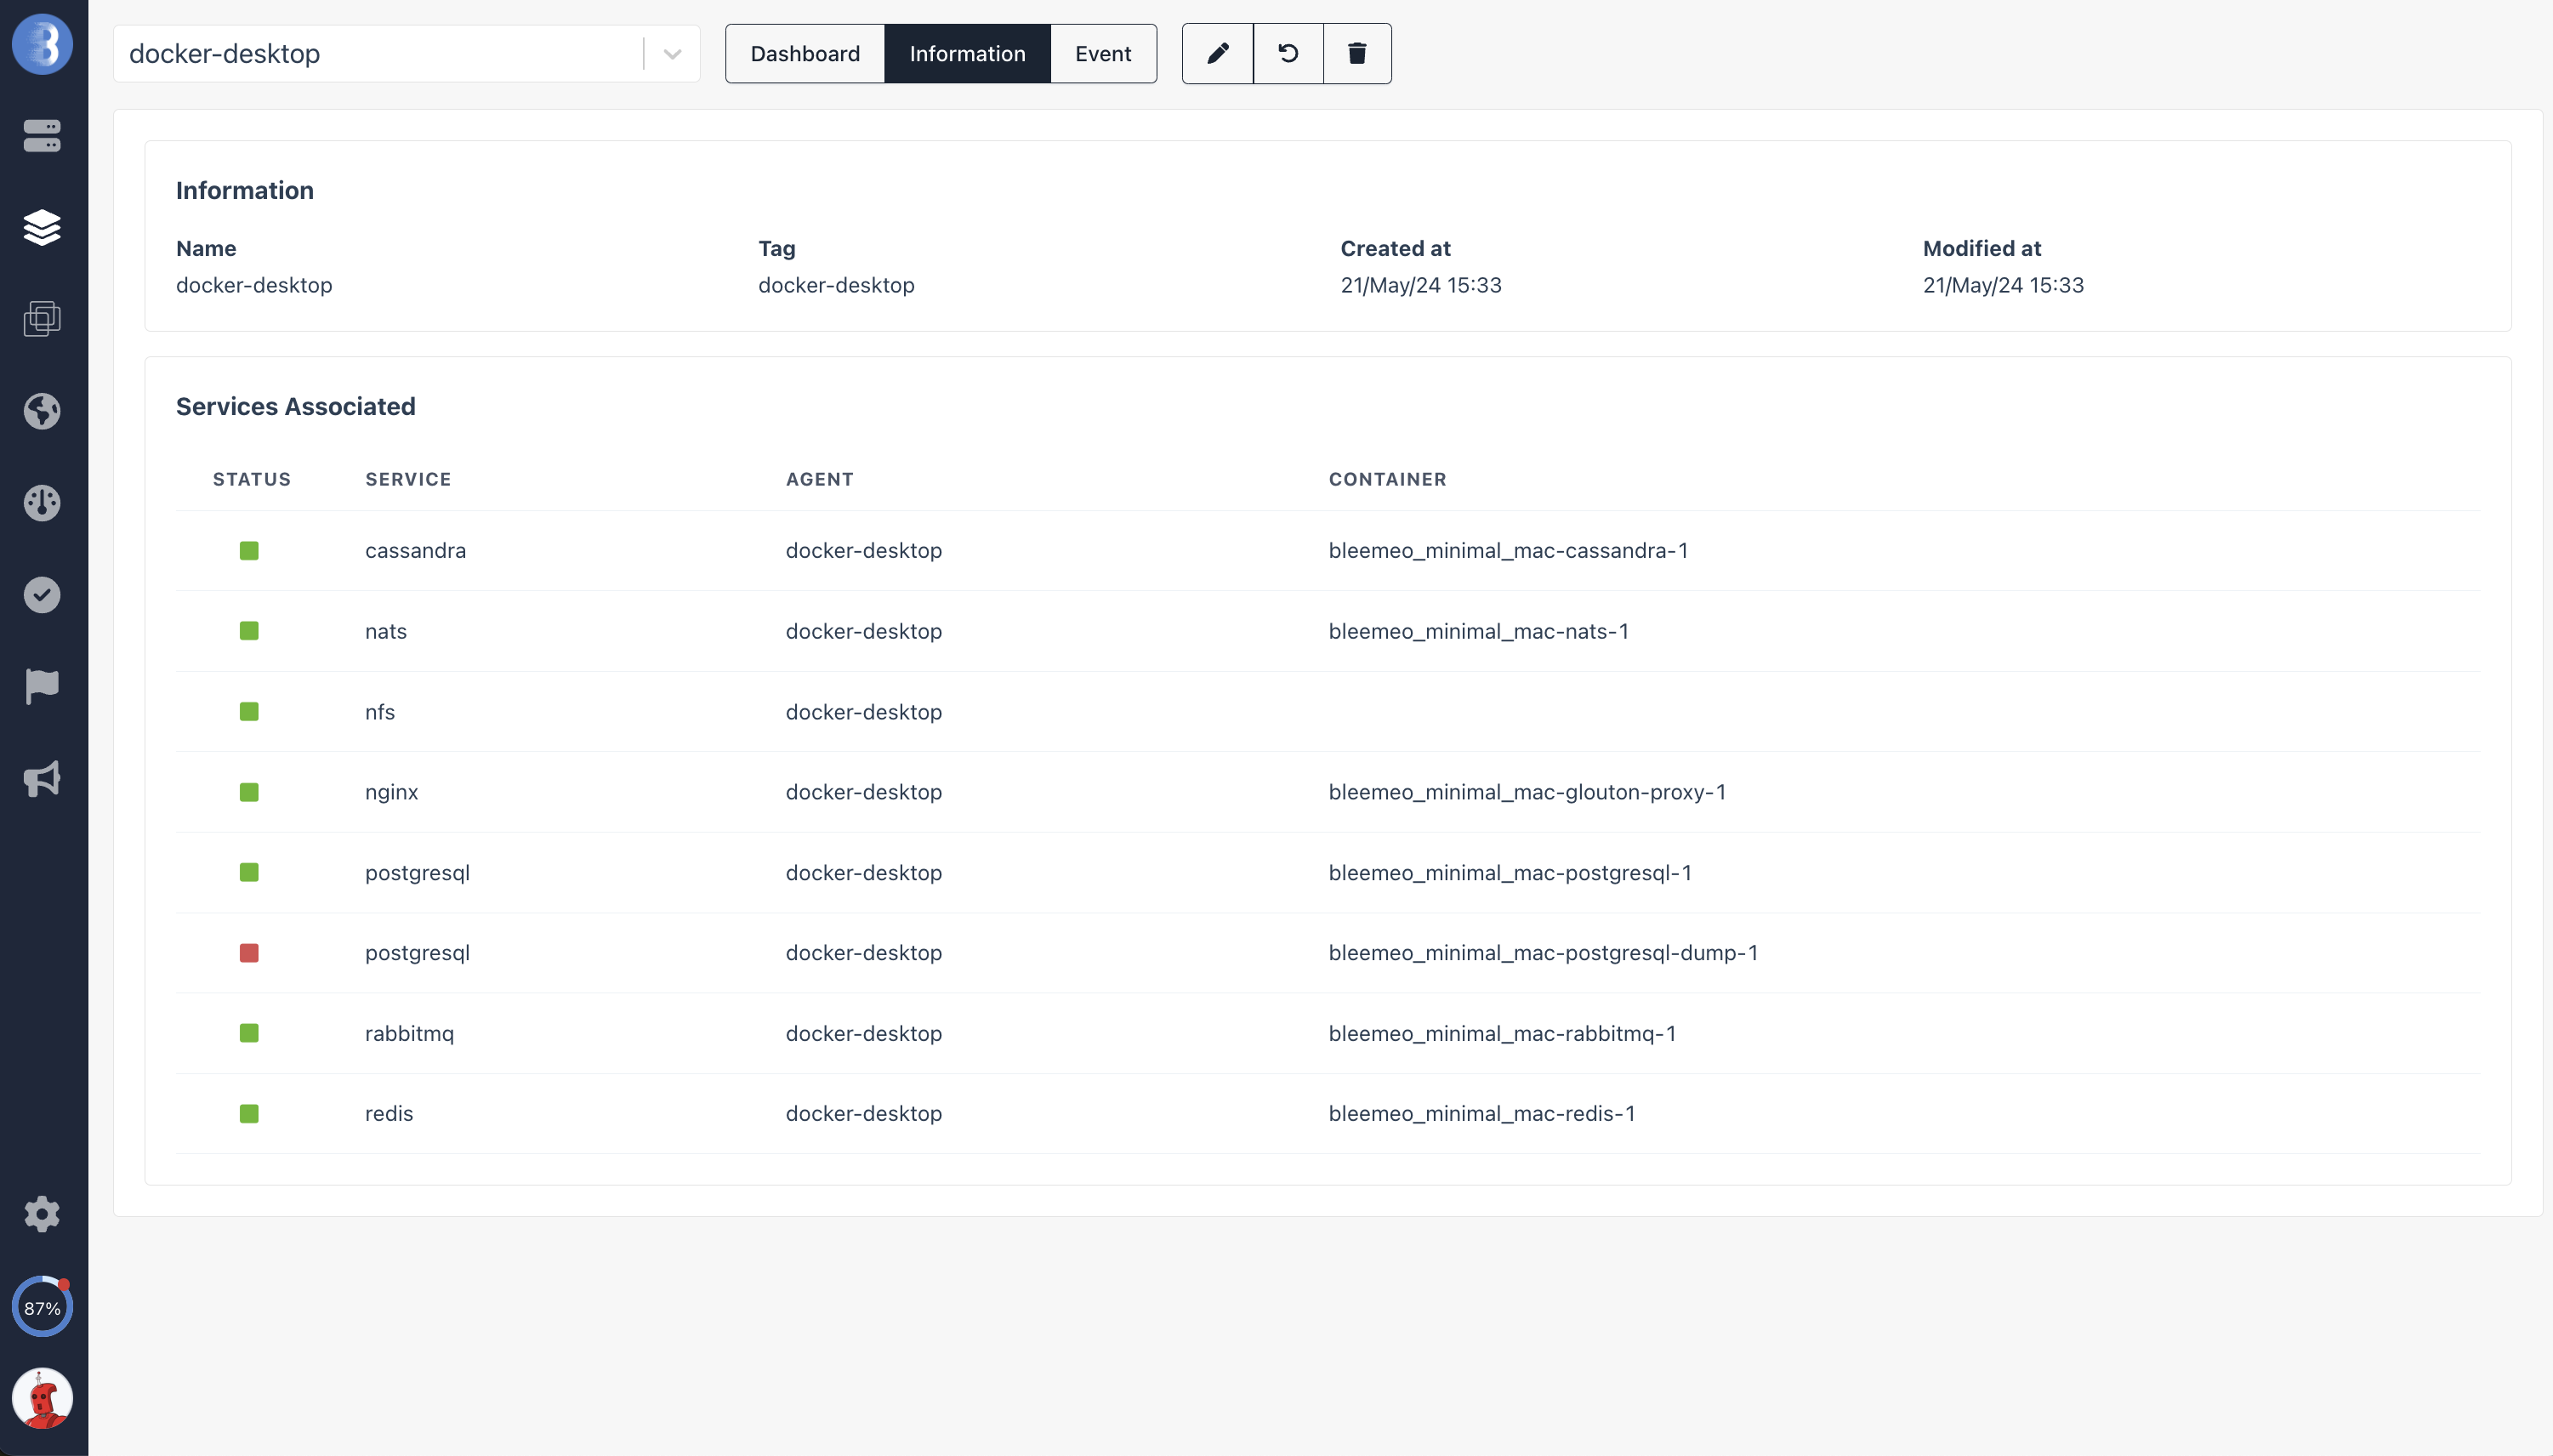
Application Information
Application service events